The Auction Market Framework & Why Liquidity Matters
Traditional technical analysis focuses on price geometry — trendlines, chart patterns, moving averages. These tools say where price has been but not how much business was done at those levels. Volume profile and liquidity density answer that missing question.
Every financial market is, at its core, a continuous two-way auction. Buyers and sellers negotiate in real time to discover a price that both sides consider fair. This simple insight — formalized by J. Peter Steidlmayer at the Chicago Board of Trade in the 1980s and later expanded by James Dalton — forms the basis of Auction Market Theory (AMT).
AMT operates on three pillars:
- Price is the advertising mechanism. It moves up to find sellers and down to find buyers. When both sides are satisfied, price stops moving.
- Time regulates opportunity. The longer price stays at a level, the more accepted that level becomes as fair value.
- Volume measures the success of the auction. High volume at a price level means genuine two-sided participation; low volume means price passed through quickly — no agreement was reached.
Markets alternate between two states: balance (range-bound, value-building) and imbalance (trending, value-seeking). Research suggests that markets spend roughly 70% of their time in balance and 30% in imbalance. The key insight for traders is that balance phases create the structural reference levels (support, resistance, fair value) that imbalance phases target and break.
Institutions care about execution quality and slippage: they need to know where they can move size without moving the market. As a trader using StrikeWatch, your edge improves when your entries, exits and stop placement are aligned with those same liquidity zones instead of arbitrary lines.
This article covers the structural layer of market microstructure: where volume accumulates and what that reveals about institutional intent. The layer that precedes it — reading the live options tape to identify who is trading and with what urgency — is in Institutional Options Order Flow: Reading the Tape and Dealer Aggression. The layer that follows it — the mechanics of placing orders at HVNs with appropriate order types and time-in-force instructions — is in Options Order Types and Execution Strategy for MT5.
Volume Profile: The Institutional Footprint
Traditional volume indicators display volume on the time axis — bars at the bottom of the chart showing how many shares traded per candle. This tells you when participation occurred, but not where.
Volume Profile rotates the axis. It displays volume on the price axis (Y-axis), creating a horizontal histogram that shows exactly how many shares or contracts were transacted at each price level. This rotation is transformative: it reveals the structural skeleton of the market — the levels where institutions built positions, where price was accepted, and where it was rejected.
Key Components of the Profile
- Point of Control (POC): The single price level with the highest transacted volume. It is the market’s center of gravity — the price of maximum agreement between buyers and sellers. Price tends to revert to the POC during balance phases.
- Value Area (VA): The range of prices encompassing approximately 68% of total volume (one standard deviation). The upper boundary is the Value Area High (VAH); the lower boundary is the Value Area Low (VAL). These act as institutional support and resistance.
- High-Volume Nodes (HVNs): Price levels with concentrated volume bulges in the profile. They represent areas of acceptance where the market built positions. Price tends to slow down and consolidate at HVNs. They often behave as value or balance areas, and are where market makers quote the tightest bid-ask spreads and deepest size. The relationship between HVN concentration and open interest clustering in the options chain is explained in Open Interest vs. Volume in Options: What They Mean and How to Use Both.
- Low-Volume Nodes (LVNs) or Gullies: Thin sections between HVNs where little traded. The market passed through these price levels quickly. LVNs act as speed zones or autobahns: when price re-enters an LVN, it tends to move rapidly to the next HVN.
In Auction Market Theory, markets oscillate between auctioning within value (rotations around HVNs) and searching for new value (moves through LVNs toward new HVNs).
Accumulation, Distribution, and Price Highways
High Volume and Narrow Ranges: Accumulation and Distribution
One of the most important patterns in StrikeWatch’s Volume module is the combination of high traded volume with relatively narrow price ranges over time:
- On the profile: an HVN thickens at a particular price zone.
- On the chart: candles show wicks and mean-reverting intraday moves rather than trending behavior.
This pattern often corresponds to accumulation or distribution: large participants trading back and forth, absorbing liquidity without letting price escape easily. For trading:
- Entering near the middle of a fresh HVN offers poor reward-to-risk — you are in the chop zone.
- Fading moves toward the edges of a mature HVN, or trading breakouts away from it, can offer better asymmetry if confirmed by options positioning and GEX.
Low-Volume Gullies: Highways for Price
In contrast, LVNs reflect price zones where the market did not spend much time or transact much volume. Once price breaks from an HVN into a gully, there are few resting orders; it often traverses the gully quickly until reaching the next HVN, where two-sided interest returns.
For options traders, this translates into crucial zones:
- Stops placed inside an LVN are more likely to slip and fill at worse-than-expected prices.
- Profit targets placed just inside the next HVN are more likely to be reached once price enters the connecting LVN.
- Short-vol structures spanning a wide LVN without protection can be vulnerable to rapid, one-sided moves.
Liquidity Density: Separating Signal from Noise
A large volume bar means nothing on its own. What matters is the relationship between volume and range. Consider two scenarios:
- Scenario A: 10 million shares trade within a 0.50% range. The order book is thick. Both sides are participating aggressively. This is genuine institutional business.
- Scenario B: 10 million shares trade within a 3.00% range. The same volume is spread across a much larger range. The market blew through multiple levels without finding acceptance. This is a liquidity vacuum — a stop-cascade or a gap that is structurally weak.
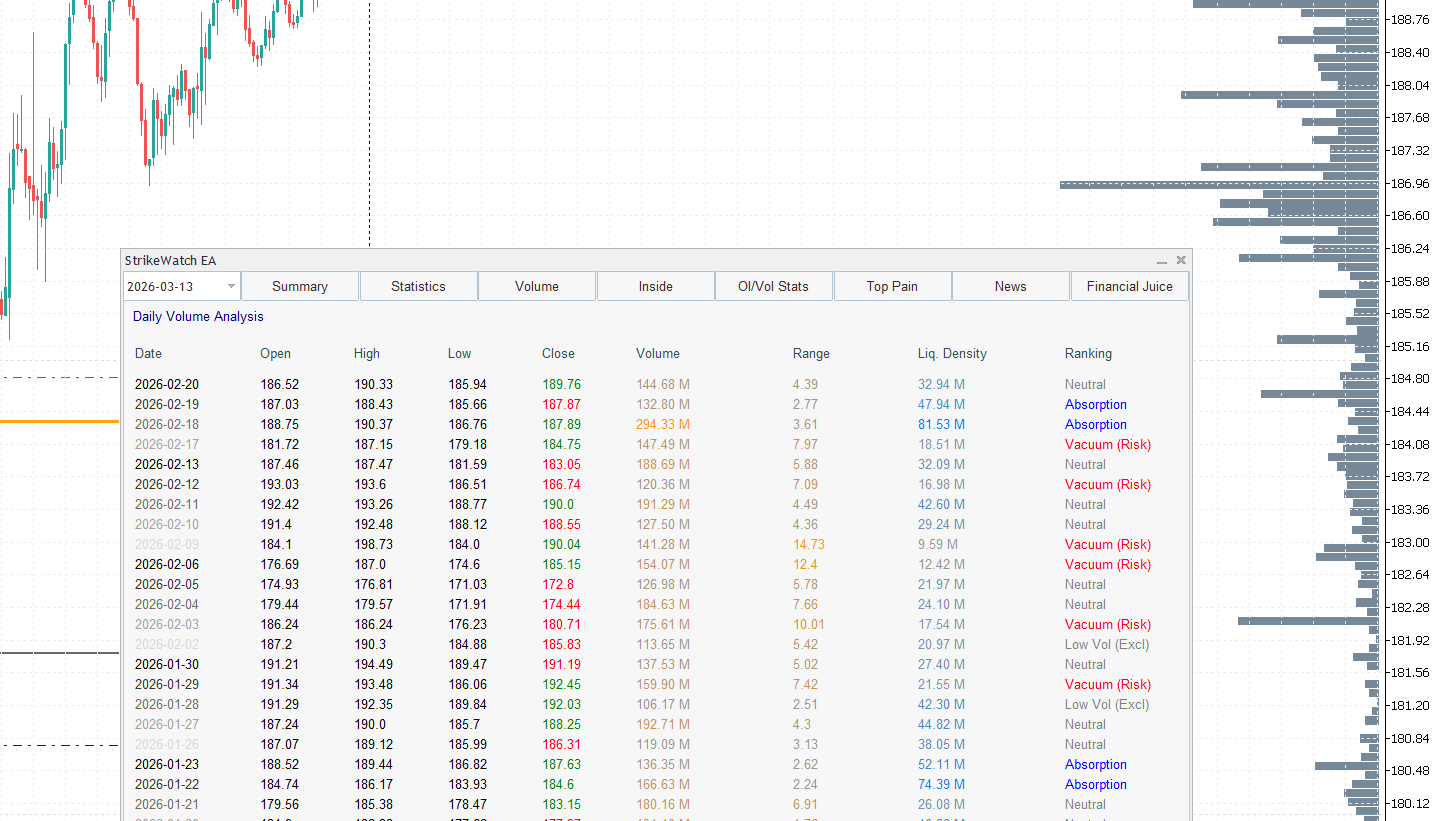
StrikeWatch EA quantifies this distinction with the Liquidity Density metric:
Liquidity Density = Volume ÷ Range
The Volume Intelligence module classifies each session into one of four regimes:
- Valid Move (High Volume + High Density): Institutional backing. The move has structural integrity and is likely to hold as a new value reference.
- Liquidity Vacuum (High Volume + Low Density): Stop run or forced liquidation. Price moved far on thin commitment. Highly likely to retrace to the origin of the move.
- Absorption (Low Volume + High Density): Hidden accumulation. A narrow range with persistent buying or selling suggests a large participant quietly building a position. Often precedes a breakout.
- Dead Zone (Low Volume + Low Density): No participation, no conviction. Holiday sessions, pre-market drift. Statistically insignificant — the module filters these out automatically.
Session vs. Composite Profiles and Timeframes
The timeframe over which you construct a Volume Profile dramatically changes its interpretation. Like any analytical tool, volume profiles behave differently across time horizons:
- Session (Intraday) Profile: Built from a single trading day’s data. Shows intraday value formation. The session POC and VA define “today’s” fair value. Institutional day-traders reference these levels for mean-reversion entries and target setting.
- Composite (Multi-day/Weekly) Profile: Built from multiple sessions (weekly, monthly, or custom periods). Reveals longer-term value acceptance. A weekly composite POC represents the price level that attracted the most institutional participation over the entire week — a much stronger structural reference than any single day. Captures swing-trade levels and where swing participants (funds, larger traders) are active.
- Monthly/Quarterly profiles: Reveal major institutional accumulation or distribution zones for long-term position trades.
Week-Over-Week Profile Analysis & Value Migration
Professional profile traders do not look at a single session in isolation. They compare profiles across multiple weeks to identify value migration — the slow, structural drift of the market’s center of gravity as institutional positions accumulate. The analytical power emerges when you overlay session and composite profiles.
Key patterns:
- Value Area overlap: If this week’s Value Area overlaps significantly with last week’s (>50%), the market is in a multi-week balance. The composite POC becomes an extremely strong reference.
- Value Area migration: If this week’s Value Area is entirely above last week’s, institutional participants are accepting higher value. This is a structural uptrend. Dip-buying to the prior week’s VAH is the institutional re-entry strategy.
- Value Area rejection: If price attempts to leave the prior Value Area but returns within one session, the breakout attempt has failed. This is a high-probability reversal setup. If today’s session POC is drifting away from the composite POC, the market is in an imbalance phase, actively searching for a new fair value.
Trading the Balance-Imbalance Cycle
The most profitable application of AMT is identifying where the market is in its balance-imbalance cycle and applying the appropriate strategy:
During Balance (Range-Bound)
- Mean-reversion trades: Buy at VAL, sell at VAH, target the POC. The market is rotating between boundaries. Each touch of the VA edge is a high-probability fade.
- Premium selling: Sell straddles or iron condors centered at the POC. Balance phases suppress realized volatility, allowing option sellers to harvest theta with controlled risk. Strategy selection and position sizing for income-generating structures in Options Strategies for Income Generation.
- Patience: Balance phases can last for days or weeks. Do not force breakout trades during balance.
During Imbalance (Trending)
- Breakout continuation: When price leaves the Value Area on high volume and does not re-enter within 30 minutes (the “80% Rule” of Market Profile), the probability of continuing to the next HVN exceeds 80%.
- LVN targeting: Once price breaks out of balance, it moves rapidly through Low-Volume Nodes. Use LVNs from historical composite profiles as the first and second price targets.
- Volatility buying: Imbalance phases expand realized volatility. Long gamma (straddles, strangles) profits as the move accelerates through LVNs. The full gamma mechanics driving this acceleration are in Dealer Hedging Regimes: GEX and Zero Gamma Level — specifically the negative GEX feedback loop that amplifies moves once price enters low-density LVN territory below ZGL.
Entries, Profit Targets, and Stops with Liquidity
Translating volume profiles into concrete trade mechanics is vital for execution quality. For large spreads or multi-leg structures, executing near dense liquidity reduces structural drag from slippage and partial fills. The complete toolkit for order types, time-in-force instructions and how to work limit orders at HVNs inside MetaTrader 5 is in Options Order Types and Execution Strategy for MT5. This section focuses on where to execute; that article covers how.
- Entries: Prefer entering near HVNs where the reward-to-risk of a move to the next HVN is favorable and where liquidity reduces slippage. Avoid sending market orders into empty pockets where a few lots move price dramatically.
- Profit targets: Place targets slightly inside the next HVN rather than at arbitrary round numbers; this aligns exits with where other participants are likely to transact. Work limit orders at prices where many participants are likely to respond.
- Stops: Avoid stops deep in LVNs. Thin liquidity guarantees worse-than-expected execution. Instead, place them just beyond HVN edges where the market has clearly rejected your level.
For options strategies, this directly informs strike selection (short strikes near HVN edges) and the choice of underlying levels for risk management. Always budget for slippage when calculating whether the trade meets your risk parameters; the dollar-risk framework is in Options Risk Management and Position Sizing Guide.
Combining Volume with Options Confluence: GEX and OI
Volume tells you where markets have transacted; Gamma Exposure (GEX) tells you how dealers will react as price approaches those levels. Combining them is powerful. The full mechanics of how positive and negative GEX create stabilizing vs amplifying dealer hedging, and what the Zero Gamma Level (ZGL) means for regime classification, are in Dealer Hedging Regimes: GEX and Zero Gamma Level. For the volume layer, the key confluences are:
- HVN + positive GEX: High liquidity and stabilizing dealer hedging. These are prime candidates for major support or resistance zones. Market makers commit deep two-sided size at these confluences, and contrarian delta-hedging reinforces price from both sides.
- LVN + negative GEX: Thin liquidity and amplifying hedging. These are zones where price can accelerate violently and overshoot. Slippage is a core risk driver here, not a rounding error. Placing market orders in this combination is the single most expensive execution mistake in options trading.
- Volume Floors and Put Walls: If a volume floor (HVN) in the underlying aligns with a major put OI cluster in the options chain, that level is a strong candidate for short put strikes, profit targets on shorts, or stop zones on longs. The relationship between open interest concentration, OI/Vol ratios and structural strike levels is in Open Interest vs. Volume in Options: What They Mean and How to Use Both. Conversely, if a thin LVN aligns with sparse options activity, expect higher slippage and less dealer support — size accordingly.
Reading the live options tape — who is buying and selling at these confluence zones, with what urgency and at what moneyness — adds the final layer of confirmation before committing a position. Tape reading methodology, aggressor-side classification and institutional vs retail flow separation are in Institutional Options Order Flow: Reading the Tape and Dealer Aggression.
Volume and Liquidity Inside StrikeWatch EA: A Practical Workflow
StrikeWatch EA delivers the complete Volume Profile workflow inside MetaTrader 5, providing tools that professional desks use:
- Deep Volume Memory: The engine caches 2 months (7 weeks) of tick-level volume data, far exceeding standard MT5 indicators that are limited to session-only views.
- Dual Modes & Comparison View: Toggle between Session (Regular) and Cumulative (Composite) profiles with a single click. Overlay today’s session profile against the weekly composite to spot real-time acceptance or rejection of established value areas.
- Liquidity Density Algorithm: The Volume Intelligence module classifies each session automatically, flagging Valid Moves, Liquidity Vacuums, and Absorption sessions with contextual heatmaps.
- Options-Volume Confluence: The HUD merges the Volume Profile with GEX levels, Zero Gamma Level (ZGL) and Max Pain overlays — identifying zones where the options market and the volume market align. The mechanics of why Max Pain creates structural price gravity near expiration are in Max Pain Theory: How Market Makers Pin Options Strikes at Expiration. The GEX and ZGL regime logic powering the overlay is in Dealer Hedging Regimes: GEX and Zero Gamma Level.
The StrikeWatch-Centric Workflow
- Identify structural levels: Use the Volume module and on-chart profiles to mark HVNs and LVNs on your timeframe. Toggle or adjust lookback windows to align a 0DTE trade with intraday nodes while ensuring the broader swing profile is not hostile.
- Overlay options structure: Check OI/Volume per strike and GEX walls to see where options risk and dealer gamma align with volume nodes. OI/Vol methodology in Open Interest vs. Volume in Options.
- Read the tape: Before placing your order, check the live options prints in OI & Flows for aggressor-side confirmation that institutional flow supports your thesis. Tape reading in Institutional Options Order Flow.
- Plan trades: Choose entries near HVNs, short option strikes near structural support/resistance, and targets near the next HVN consistent with your thesis.
- Set stops: Place stops beyond HVN edges rather than inside LVNs to avoid the worst slippage. Order types and limit-setting mechanics in Options Order Types and Execution Strategy for MT5.
- Monitor regime shifts: If new volume builds a fresh HVN or LVN, or if GEX/ZGL shifts, update your map and adjust risk accordingly.
Used this way, StrikeWatch turns volume profiles from a static chart decoration into a living model of where institutions actually transact — and how you can trade alongside them.
Key Takeaways
- Volume profile answers the question price cannot: not just where price went, but how much business was done there. Price geometry (trendlines, moving averages) is structurally blind to this dimension.
- POC is the market’s center of gravity. In balance phases, price gravitates toward the Point of Control. Entries that fight the POC during balance have a structural headwind; entries near the POC during imbalance breakouts miss the move before it extends.
- HVNs are where markets build positions; LVNs are highways. Execute at HVNs for tight spreads and deep liquidity. Expect rapid, slippage-prone moves through LVNs. Never place stops deep inside an LVN. Full execution mechanics for HVN/LVN order placement in Options Order Types and Execution Strategy for MT5.
- Liquidity Density separates institutional moves from stop runs. High Volume + High Density = Valid Move (hold or fade the retest). High Volume + Low Density = Liquidity Vacuum (fade back to origin). Low Volume + High Density = Absorption (watch for breakout).
- Composite profiles reveal multi-week institutional positioning. A weekly composite POC is a far stronger structural reference than any single session POC. Value Area migration across weeks identifies structural uptrends or downtrends with far more reliability than price-only indicators.
- The balance-imbalance cycle dictates strategy, not just direction. Balance phases call for premium selling centered at POC; imbalance phases call for long gamma and LVN targeting. Forcing the wrong strategy in the wrong phase is a structural mismatch. Income strategy selection in Options Strategies for Income Generation.
- HVN + positive GEX is the highest-quality structural zone. Deep two-sided liquidity from volume history plus contrarian dealer hedging from positive gamma creates the strongest support and resistance confluences on the chart. Full GEX and ZGL mechanics in Dealer Hedging Regimes: GEX and Zero Gamma Level.
- LVN + negative GEX is the most dangerous execution zone. Thin resting orders combined with momentum-amplifying dealer hedging produce the widest effective spreads and the fastest moves. Size down or avoid market orders entirely in this combination.
- OI clusters in the options chain co-locate with HVNs in the underlying. Strikes with the highest open interest and volume attract the deepest market-maker quoting, and they are typically anchored near structural HVNs. Cross-referencing the two confirms whether a level has both volumetric and options-market backing. OI/Vol framework in Open Interest vs. Volume in Options.
- Max Pain and ZGL complete the structural map. HVN/LVN maps provide the volume skeleton; Max Pain adds the gravity well that pulls spot near expiration; ZGL marks the regime boundary where dealer hedging flips from stabilizing to amplifying. All three are overlaid natively in StrikeWatch EA.