Volume: Today’s Activity Counter
Volume is the total number of options contracts that trade (change hands) during a single trading session. Every time a contract is bought or sold, volume increases by one — regardless of whether it is a new position opening or an existing position closing.
- Volume resets to zero at the start of each trading day.
- Volume counts every transaction: opening buys, opening sells, closing buys, closing sells.
- The same contract can change hands multiple times within one day, each time adding to volume.
- High volume = active trading = higher liquidity = tighter bid-ask spreads.
Example: At market open, 0 contracts of the AAPL $190 call have traded (volume = 0). Trader A buys 10 contracts from a market maker. Volume = 10. One hour later, Trader A sells those same 10 contracts to Trader B. Volume = 20. By end of day, those 10 contracts may have changed hands 5 more times. Volume = 70. But only 10 contracts exist — they just traded back and forth.
This is why volume alone does not tell you how many contracts exist. It only tells you how actively contracts are being traded today.
Open Interest: The Cumulative Position Counter
Open interest (OI) is the total number of options contracts that are currently open — not yet closed, exercised, or expired. It measures how many contracts are “alive” in the market at any given moment.
- OI is updated overnight, after the trading session ends. It does not change intraday — the number you see during the session reflects yesterday’s close.
- OI increases when both sides of a trade are opening new positions (one new long + one new short = 1 new contract created).
- OI decreases when both sides are closing existing positions (closing long + closing short = 1 contract destroyed).
- OI stays unchanged when one side opens and the other closes (a contract transfers from one trader to another; no net new contract is created or destroyed).
| Transaction | Buyer Action | Seller Action | Volume Effect | OI Effect |
|---|---|---|---|---|
| New trade (both opening) | Opens new long | Opens new short | +1 | +1 (new contract created) |
| Closing trade (both closing) | Closes long | Closes short | +1 | −1 (contract destroyed) |
| Transfer (one opens, one closes) | Opens new long | Closes existing short | +1 | 0 (contract transfers) |
| Transfer (one closes, one opens) | Closes long | Opens new short | +1 | 0 (contract transfers) |
Key takeaway: Volume counts all trades. Open interest only changes when the total number of open contracts changes. Volume is a flow metric (today’s activity). Open interest is a stock metric (cumulative positioning).
Side-by-Side: Volume vs. Open Interest
| Feature | Volume | Open Interest |
|---|---|---|
| What it measures | How many contracts traded today | How many contracts are currently open |
| Reset frequency | Resets to zero every morning | Updates overnight; accumulates over the option’s life |
| Update timing | Real-time (updates with every trade) | End-of-day (calculated after session close) |
| Can exceed the other? | Yes — volume can exceed OI in a single day | N/A — OI is an independent cumulative measure |
| Tells you about | Liquidity and immediate session interest | Cumulative positioning and structural significance |
| Stock market analogy | Equity volume (identical concept) | No stock equivalent — unique to derivatives |
| Primary use | Liquidity check before entering a trade | Structural level identification; GEX analysis; Max Pain |
The Four Volume/OI Scenarios
The relationship between volume and the direction of OI change tells you exactly what type of activity is occurring at a given strike. These four combinations each carry a distinct market signal — and confusing them is one of the most common errors in options analysis:
| Scenario | Volume | OI Change | What Is Happening | Market Signal |
|---|---|---|---|---|
| New money entering | High | Rising ↑ | New positions are being created. Both buyers and sellers are opening fresh contracts. | Conviction signal. Price rising + OI rising = new longs entering (bullish). Price falling + OI rising = new shorts entering (bearish). Either way, it confirms the direction. |
| Liquidation | High | Falling ↓ | Existing positions are being closed. Both sides are exiting the market. | Trend exhaustion warning. Participants are taking profits or cutting losses. The move may be nearing its end — the fuel is running out. |
| Position transfer | High | Flat | Contracts are changing hands but the total number of open contracts is stable. One side opens while the other closes. | Neutral / rotation. Active trading with no net change in positioning. Typical of market-making activity or institutional rotation between strikes. |
| No conviction | Low | Flat | Neither new positions nor closures. The market is quiet at this strike. | Indecision or disinterest. Do not trade this strike — wait for volume or OI to pick up before acting. |
High volume + rising OI + price moving in one direction is the strongest possible market structure signal. New money is entering in the direction of the move, confirming directional conviction rather than rotation or liquidation. This is the combination institutional flow analysts watch most closely. The options chain guide covers the Volume/OI ratio threshold at which this combination becomes an anomaly worth acting on.
Using Volume and OI for Liquidity Assessment
Before entering any options trade, check both volume and OI to ensure adequate liquidity. The bid-ask spread — your real transaction cost — is directly determined by how actively a strike is traded. Illiquid strikes can cost you 10–20% of position value on the round-trip:
| Liquidity Level | Daily Volume | Open Interest | Bid-Ask Spread | Suitability |
|---|---|---|---|---|
| Excellent | > 1,000/day | > 5,000 | < $0.05 | All strategies; institutional-grade execution |
| Good | 200–1,000/day | 1,000–5,000 | $0.05–$0.15 | Most retail strategies; manageable spread cost |
| Marginal | 50–200/day | 500–1,000 | $0.15–$0.50 | Simple strategies only; wider spreads erode edge |
| Poor | < 50/day | < 500 | > $0.50 | Avoid; fills will be poor and exits difficult |
Practical sizing rule: Stick to strikes where open interest is at least 10× your intended position size. If you want to trade 10 contracts, OI should be at least 100 at that strike. This ensures your order is a small fraction of the total market and you can exit without moving the price against yourself.
Note that volume — and therefore liquidity — concentrates heavily at ATM strikes and decreases as you move further ITM or OTM. For OTM strikes used in spreads or iron condors, always verify sufficient OI before entering: high OI but very low daily volume at an OTM strike means the position exists on paper but may be difficult to exit efficiently.
OI as Structural Support and Resistance
Open interest does more than measure positioning — it creates structural levels that mechanically influence price behavior through dealer hedging:
- High put OI at a strike below spot: Market makers who sold those puts are short delta. As price approaches the strike, they buy shares to stay delta-neutral — creating mechanical support (buying pressure that resists further downside).
- High call OI at a strike above spot: Market makers who sold those calls are long delta. As price approaches the strike, they sell shares to stay delta-neutral — creating mechanical resistance (selling pressure that caps further upside).
GEX (Gamma Exposure) quantifies this mechanical hedging pressure mathematically — it converts raw OI at each strike into a dollar-denominated measure of how aggressively dealers must rebalance for every $1 move in the underlying. The full mechanics of how GEX creates positive and negative gamma regimes, and where the Zero Gamma Level sits relative to these OI concentrations, are covered in the Dealer Hedging Regimes & GEX guide. The aggregate effect of all OI-weighted hedging flows also determines the Max Pain level — the strike where total dealer payout is minimized at expiration.
Volume Spikes and Unusual Activity
A sudden spike in volume at a specific strike — particularly when today’s volume significantly exceeds the existing open interest — signals that a large new position is being established rapidly. The most telling scenario: volume that exceeds the prior day’s total OI at the same strike means more contracts were traded today than existed yesterday — an entirely new position of institutional scale has been built in a single session.
Not all volume spikes are actionable. A spike with rising OI the following morning confirms genuine new positioning (someone opened a large bet). A spike with flat or falling OI confirms closing activity or a roll — the position is ending, not beginning. Only the first scenario carries forward-looking directional information. The full framework for classifying volume spikes — including the sweep, block, and golden sweep taxonomy, the five-signal diagnostic table, and the three context filters (earnings proximity, OI buildup pattern, GEX regime) — is covered in the Unusual Options Activity guide.
The OI Lifecycle
Open interest follows a predictable lifecycle for any given options expiration. Understanding this cycle determines when OI data is informative and when it is noise:
- Listing (8–12 weeks before expiration): OI starts near zero. Initial positions are established by early-movers. Volume and OI are both low — structural levels are not yet meaningful because positioning is too sparse.
- Accumulation (6–8 weeks out): OI increases steadily as traders open positions in earnest. This is typically when institutional trades are established for monthly expirations. Rising OI + rising price = bullish conviction building. Rising OI + falling price = bearish positioning being established.
- Peak (2–4 weeks out): OI typically peaks approximately 2–4 weeks before expiration for monthly options. This is the optimal window for structural analysis — positioning is at maximum, GEX effects are strongest, and put/call walls are most clearly defined.
- Decay (final 2 weeks): OI begins declining as traders close or roll positions ahead of expiration. Delta-hedging flows intensify simultaneously as gamma increases. The combination of falling OI and rising gamma is what creates pin risk and the Max Pain gravitational pull in the final sessions.
- Expiration day: All remaining OI settles. ITM options are auto-exercised for contracts more than $0.01 in the money (OCC Rule 805). OTM options expire worthless. OI for this expiration goes to zero.
The best window for structural OI analysis is the peak phase: 2–4 weeks before expiration. During the listing phase, OI is too sparse to define meaningful levels. During the late-decay phase, rolling activity is diluting the original positioning. The peak phase is when the options market has formed its most complete structural map.
Common OI/Volume Mistakes
- Treating volume and OI as the same thing. Volume is flow (today’s activity). OI is stock (cumulative). High volume today does not mean high OI, and high OI does not mean there was high volume today. Reading only one measure systematically misses half the picture.
- Assuming all high-volume trades are “smart money.” Volume spikes can come from retail speculation, market-making activity, hedge adjustments, or spread leg execution. Actionable institutional signals require volume that is single-strike, directional, filled at the ask (aggressor buying), and accompanied by rising OI the following session.
- Ignoring the opening vs. closing distinction. High volume with rising OI means new money entering (conviction). High volume with falling OI means positions closing (unwinding). The same volume number tells opposite stories depending on the OI change direction.
- Reading OI in isolation without relative context. An OI of 10,000 at a strike is meaningless without comparison to surrounding strikes and to the stock’s historical OI levels. A strike that is the highest-OI level on the entire chain matters structurally. A strike that is one of dozens with similar OI does not.
- Trading illiquid strikes based on OI alone. High OI but very low daily volume means positions are “stuck” — traders opened positions but are not actively trading them. The bid-ask spread may be wide despite significant OI. Always verify daily volume confirms efficient execution before entering.
- Analyzing OI outside its optimal lifecycle window. OI data during the listing phase (8+ weeks out) is too sparse for structural analysis. OI during the late-decay phase (final week) is distorted by rolling activity. Peak-phase OI (2–4 weeks out) is the most reliable signal.
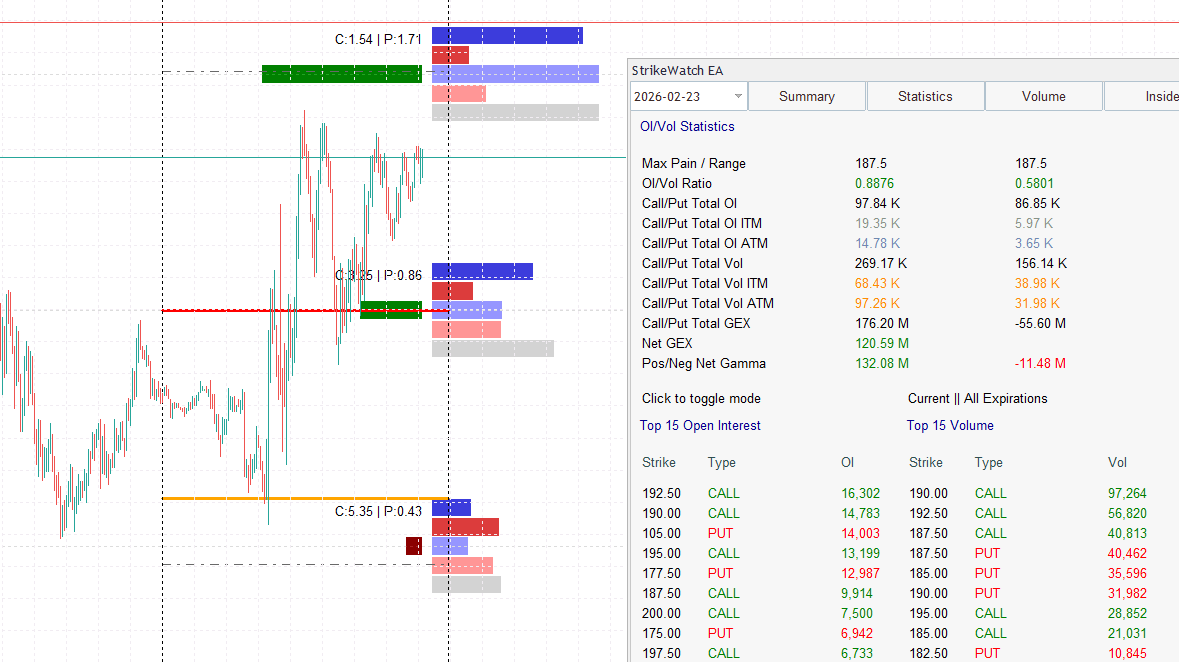
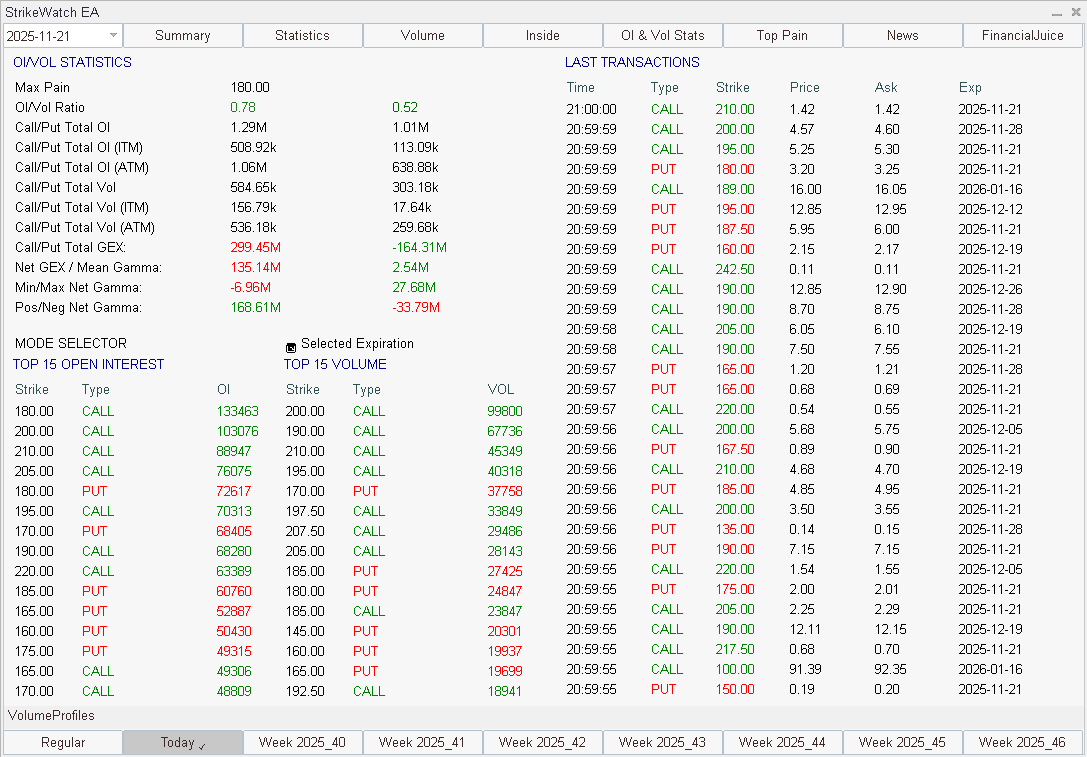
OI/Volume Analysis in StrikeWatch EA
StrikeWatch EA’s OI/Volume Statistics module provides granular per-strike data that transforms raw OI and volume numbers into actionable structural intelligence directly inside MetaTrader 5:
- Top 15 Strikes: The module identifies the 15 strikes with the highest combined put + call activity, displaying volume and OI for each side. This immediately reveals where the market is most concentrated — the strikes that carry structural weight for GEX analysis and Max Pain calculation.
- Per-Strike Put/Call Ratio: At each strike, the put-to-call volume and OI ratio shows directional bias at that exact price level — whether the concentration is defensive (put-heavy floor) or speculative (call-heavy ceiling). Full PCR mechanics are covered in the Put/Call Ratio guide.
- GEX Integration: OI data feeds directly into the GEX Profile calculation. Strikes with the highest OI generate the largest Gamma Exposure values, which create the strongest structural support and resistance effects. The OI module shows where positions are concentrated; the GEX module shows what mechanical effect that concentration creates on price. Full dealer-hedging mechanics and GEX regime classification in Dealer Hedging Regimes: GEX and the Zero Gamma Level.
- Max Pain Connection: The Max Pain level is calculated from the full OI distribution across all strikes. As OI shifts during the week — through openings, closings, and rolls — the Max Pain strike updates in real time, revealing the gravitational center for the current expiration cycle.
- OI Lifecycle Tracking: By comparing per-strike OI across multiple sessions in the Term Structure view, you can identify whether the current cycle is in accumulation (OI rising), peak (OI plateauing), or decay (OI falling) — the key contextual input for determining how much structural weight to assign any given OI concentration.

Volume is flow; OI is stock. Volume counts today’s transactions
and resets each morning. OI counts cumulative live contracts and updates overnight.
They measure different things and must be read together to understand what is actually
happening at any strike.
The four scenarios are the core diagnostic framework. High volume +
rising OI = new money (conviction). High volume + falling OI = liquidation (exhaustion).
High volume + flat OI = rotation (neutral). Low volume + flat OI = no signal. Never
read volume without checking the OI direction.
OI below 10× your position size = liquidity risk. Verify both
volume and OI before entering any trade. High OI with low daily volume means the
strike is “stuck” and exits may be costly.
Peak OI (2–4 weeks out) is when structural analysis is most reliable.
The OI lifecycle moves from sparse (listing) → meaningful (accumulation) → maximum
signal (peak) → distorted by rolls (decay). Analyze OI in the peak window for the
highest-quality structural levels.
OI creates mechanical price levels through dealer hedging. High put OI
below spot = dealer buying creates support. High call OI above spot = dealer selling
creates resistance. GEX quantifies
this effect; Max Pain shows its aggregate target. See the
Strike Wall Analysis framework
for how all four structural layers converge into a scoring system.