What Is Unusual Options Activity?
Unusual options activity (UOA) occurs when trading volume at a specific options contract significantly exceeds its normal baseline — typically 5x or more above the 20-day average volume at that strike. While normal options volume reflects the continuous background of hedging programs, income generation, and retail speculation, unusual activity stands out because it often represents informed positioning: institutional traders, hedge funds, or in some cases corporate insiders expressing a high-conviction directional view with significant capital.
The underlying logic is straightforward. Large traders do not deploy millions of dollars into options casually. When a single order or coordinated series of orders pushes volume at a specific strike to 10x its norm, it signals that someone with conviction — and likely an informational edge or institutional research advantage — is committing capital to a directional thesis. Academic and industry research consistently confirms that stocks exhibiting unusual options activity are approximately five times more likely to experience significant price moves within the following sessions.
However, not all unusual activity is actionable. Some represents systematic hedging (reactive, not predictive), some is roll activity (maintaining existing exposure, not initiating new conviction), and some is market-making inventory management. The complete framework for classifying flow into hedging vs. speculative archetypes and identifying roll signatures is covered in the Options Order Flow & Market Maker Positioning guide. This article focuses on the specific taxonomy and detection framework for UOA signals that pass the institutional conviction threshold.
The Four UOA Order Types
Institutional options flow manifests in four distinct patterns. Each carries different information content and a different level of reliability as a directional signal:
Sweep Orders: The Urgency Signal
A sweep order is a large options trade split across multiple exchanges simultaneously to achieve rapid, complete execution. Rather than posting a limit order at one exchange and waiting for a fill, the institution routes order fragments to every available exchange at the same time — accepting whatever price each exchange offers to guarantee immediate execution.
Sweeps are the highest-conviction order type precisely because they reveal urgency. The trader is willing to pay a premium across multiple venues rather than wait for a better fill — which means speed matters more than price. This is the behavioral signature of time-sensitive information. A call sweep filled at or above the ask is aggressively bullish. A put sweep filled at or below the bid is aggressively bearish. The aggressor side is the primary diagnostic: mid-market fills on sweeps are more ambiguous and require additional confirmation.
Block Trades: The Strategic Positioning Signal
A block trade is a single large transaction — typically 100+ contracts — negotiated privately off-exchange and then reported to the consolidated tape. Unlike sweeps, blocks do not interact with the public order book, which means they avoid slippage and prevent information leakage during execution. This is why large institutions prefer blocks for positions they want to establish quietly.
Blocks signal strategic positioning rather than urgent conviction. They are the preferred order type for pension funds, endowments, and hedge funds building multi-week or multi-month positions. Because blocks are negotiated off-exchange, they often execute between the bid and ask — making aggressor-side determination harder without context from the underlying stock’s simultaneous price action.
Golden Sweeps: Maximum Signal Concentration
A golden sweep is a sweep order that simultaneously meets three criteria for maximum information content:
- Premium exceeds $100,000 — institutional-scale capital commitment, not retail.
- Option is near-the-money (Delta > 0.40) — ATM/near-ATM precision signals a specific price target, not a tail hedge.
- Implied volatility is above average — the buyer is paying elevated premium, which indicates conviction strong enough to justify the extra cost.
Golden sweeps represent the intersection of size, urgency, and strike precision — making them the single highest-signal order type in publicly observable options flow. When multiple golden sweeps appear in the same direction on the same underlying within a short time window (clustered golden sweeps), the probability of a significant directional move increases substantially. Professional flow traders treat clustered golden sweeps as their highest-conviction setup class.
Dark Pool + Options Combo: The Invisible Accumulation Signal
The most sophisticated institutional positioning involves simultaneous execution across dark pools and options exchanges. A fund accumulates stock in a dark pool (invisible to the lit market, no public price impact) while simultaneously hedging its exposure on a public options exchange (visible, reportable to the tape). The equity leg is hidden; the options leg is detectable.
This creates a powerful asymmetric detection opportunity: the options flow you see on the chain is only half of the trade. When StrikeWatch EA’s OI/Volume module shows unusual put buying at a specific strike while the equity volume analysis simultaneously flags absorption (unusually high equity volume with a narrow price range — supply being absorbed without price movement), you may be detecting the visible hedge of an invisible institutional accumulation. The combination of both signals increases the probability of a large subsequent move significantly above either signal alone.
The Five-Signal Diagnostic Table
Not every volume spike constitutes actionable unusual activity. Apply these five diagnostic signals to filter genuine institutional flow from market noise. Reliability increases multiplicatively as more signals align simultaneously:
| # | Signal | Threshold | What It Means | Reliability |
|---|---|---|---|---|
| 1 | Volume/OI Ratio > 2.0 | Today’s volume exceeds 2× prior open interest at that strike | New positions being opened — not just churn of existing contracts | High — especially when prior OI was low |
| 2 | Volume > 5× Average | Today’s volume exceeds 5× the 20-day average at the strike | Abnormal interest; institutional assessment of this level has changed | Moderate — requires additional confirmation |
| 3 | Aggressive Pricing | Orders filled at ask (calls) or at bid (puts) | Aggressor is buying, not providing liquidity; reveals directional urgency | High — aggressor detection is the gold standard |
| 4 | Premium Size > $250K | Total premium deployed in a single burst exceeds $250,000 | Institutional-scale capital; retail traders rarely deploy this size in a single order | High — size is a proxy for conviction |
| 5 | Concentrated Strike + DTE | Activity focused on a single strike, single expiration, 7–30 DTE | Specific price target with defined time frame; not a broad portfolio hedge | High — precision indicates informed positioning |
The strongest UOA signals occur when all five criteria align simultaneously: a golden sweep at a single OTM strike with V/OI > 5.0, filled at the ask, with $500K+ premium, targeting a 21-DTE expiration. When this cluster appears, the probability of a significant move in the underlying is extremely high. Even so, apply the three context filters in Section 4 before acting — a five-signal convergence during earnings week is still largely noise.
Three Context Filters
Raw UOA data without context is unreliable. A massive put sweep might appear bearish — but if it is part of a collar against a large equity position, it is actually the hedge of a bullish position. Context transforms raw flow data into actionable intelligence. Apply these three filters in sequence before assigning directional weight to any UOA signal:
Filter 1 — Earnings Proximity
Options volume spikes naturally 1–5 days before earnings announcements. Much of this activity is volatility trading — straddles, strangles, and iron flies positioned for the IV crush — rather than directional betting. A large call sweep before earnings might be one leg of a straddle, not a conviction buy. Check whether the flow is one-sided (all calls or all puts = directional) or two-sided (both calls and puts on same underlying = volatility position) before assigning a directional interpretation. Discard UOA signals with earnings within 7 days unless the flow is clearly one-sided and passes the other two filters.
Filter 2 — OI Buildup Pattern
Did OI at this strike build gradually over several days or weeks, or did it spike overnight from a single event? Gradual OI accumulation over multiple sessions suggests repeated conviction — the institution returned to the same strike on multiple days to add to its position. This behavioral pattern is far more reliable than a single overnight OI spike, which could be a one-off hedge, a roll, or a short-term arbitrage. For the full mechanics of how to read OI buildup patterns and the OI lifecycle, see the OI Lifecycle section of the Open Interest vs. Volume guide.
Filter 3 — GEX Regime Confirmation
The GEX regime determines how likely a directional flow signal is to produce follow-through price movement. In a positive GEX regime (market above the Zero Gamma Level), dealers are long gamma and trade contrarian to price moves — suppressing volatility and reducing follow-through. A call sweep in positive gamma may produce limited directional movement as dealer hedging counteracts momentum. In a negative GEX regime (market below the ZGL), dealers are short gamma and trade with price moves — amplifying momentum and increasing follow-through probability for the same call sweep.
IV Rank adds a second dimension to this filter. Unusual call buying when IV Rank is below 20 means the buyer is paying relatively cheap options — a favorable risk/reward ratio for the institutional buyer and a confirmation that the positioning is genuine. The same buying when IV Rank is above 80 means the buyer is paying elevated premium; the conviction must be extremely high to justify the cost, which paradoxically increases the signal quality when the other filters also pass. For the full GEX/ZGL framework, see the Dealer Hedging Regimes & GEX guide.
The most reliable UOA trades meet all three context filters: (1) no earnings within 7 days, (2) gradual OI accumulation over multiple sessions, and (3) GEX regime confirms follow-through probability. A golden sweep passing all three filters becomes one of the highest-probability setups available to retail traders from publicly observable data.
The V/OI Quality Matrix
Once a UOA signal passes the five-signal diagnostic and the three context filters, use the V/OI Quality Matrix to assess the directionality of the signal — not just its size. The combination of call/put type, stock price direction, and the next-day OI change determines whether the volume spike represents conviction buying, position unwinding, or a contrarian institutional setup:
| Volume Type | Stock Price | OI Change (Next Day) | Interpretation |
|---|---|---|---|
| High call volume | Rising ↑ | Rising ↑ | Strongest bullish signal. New long calls opened as price rises = institutional buying with follow-through momentum |
| High call volume | Rising ↑ | Falling ↓ | Short call covering. Previous shorts exiting — bullish but exhaustible. Rally may fade as covering completes |
| High call volume | Flat / Falling | Rising ↑ | Contrarian accumulation. New long calls opened despite price weakness = institutional buying the dip with conviction. Watch closely |
| High put volume | Falling ↓ | Rising ↑ | Strongest bearish signal. New long puts opened as price falls = institutional selling with directional conviction |
| High put volume | Falling ↓ | Falling ↓ | Long put profit-taking. Bearish positions being closed — the decline may be reaching its end |
| High put volume | Rising ↑ | Rising ↑ | Portfolio hedging. New protective puts opened on a rising stock = bullish equity position being insured, not a bearish bet |
The rows where price and OI move in confirming directions represent the highest-conviction signals. The rows where OI decreases represent unwinding of existing positions — still informative for timing exits but less actionable for new entries. The put-volume-rising row is the most commonly misread: large put buying on a rising stock is almost always portfolio protection, not a bearish bet.
Sector-Level Flow Analysis
Some of the most reliable UOA signals occur at the sector level rather than in individual stocks. When unusual call activity appears simultaneously across multiple stocks in the same sector (e.g., NVDA, AMD, AVGO, and TSM all lighting up on the same day), it signals a sector-wide institutional thesis — driven by a macro catalyst, supply chain development, or regulatory change affecting the entire group.
Sector-level flow carries higher reliability than single-stock flow for three reasons: it is harder to fake (requires coordinated capital across multiple names), harder to hedge away (the thesis applies broadly), and requires significantly more aggregate capital — which means the institution has higher confidence in the thesis before committing. A single stock might see unusual activity from one fund’s idiosyncratic view. When 5–10 stocks in the same sector show simultaneous UOA, the probability of a significant sector-level move is substantially higher.
Monitor sector-level flow by watching both ETF options (XLK, XLF, XLE, XBI, SMH) and their largest constituents in parallel. When ETF-level put buying coincides with single-stock call selling across the sector, it often signals institutional rotation — reducing sector exposure through puts and calls while moving capital to a different sector or asset class. This rotation signal frequently precedes visible sector underperformance by 1–3 weeks.
Execution Framework: From Signal to Trade
Detecting UOA is only half the process. Translating a confirmed signal into a trade that manages risk while capturing the opportunity requires a disciplined four-step framework:
Step 1 — Read the Institutional Thesis
From the flow data, extract the institution’s implied bet: “What is this trade expecting?” A call sweep at the $200 strike, 21-DTE, on a stock trading at $185 says: “the institution expects this stock to be above $200 within three weeks.” The strike price is the implied price target. The DTE is the time frame. The premium deployed is the conviction level. Your trade should be structured to profit from the same thesis.
Step 2 — Position Sizing
Never risk more than 1–2% of account on any single flow-based trade. Even the highest-quality UOA signals fail 30–40% of the time. The institutional trader has risk management infrastructure that allows them to absorb losses on failed signals; retail follow-through traders need equally disciplined position sizing to survive the inevitable failure rate. A string of five consecutive losses at 1% risk is a 5% drawdown — recoverable. At 5% risk per trade, the same string is a 25% drawdown — potentially account-threatening.
Step 3 — Stops and Targets
Set a stop at 50% of premium paid. If the option loses half its value and the underlying has not moved in the expected direction, the thesis is likely wrong — exit and preserve capital. The cost of being early on a correct thesis (re-entry later) is far lower than the cost of holding a losing position to expiration. Set a profit target at 100–200% of premium paid. Flow-based trades often produce binary, sharp outcomes: either the thesis plays out quickly or it does not play out at all. Taking 100–200% when the signal materializes is superior to holding for maximum theoretical gain that may never arrive.
Step 4 — Entry Timing with Technical Context
UOA provides the who and the what; technical analysis provides the where for optimal entry. Combining a confirmed UOA signal with a technical entry at a key structural level — a GEX support zone, a high-volume node from the volume profile, or a retest of a breakout level — creates a higher-probability entry than acting on the flow signal immediately at the open. Patience for a technically superior entry on a confirmed flow signal is one of the highest-edge behaviors available to retail flow traders.
Common UOA Mistakes
- Acting on volume spikes without confirming OI change. High volume with falling OI the next day means the position is being closed, not opened. Only rising OI confirms new positioning worth following. See the Open Interest vs. Volume guide for the complete volume/OI interaction matrix.
- Treating all large put buying as bearish. Large put volume on a rising stock with rising OI is almost always portfolio protection, not a directional bet. The V/OI Quality Matrix in Section 5 prevents this misreading.
- Ignoring earnings proximity. Pre-earnings volume spikes are often volatility trades (straddles, strangles) with zero directional content. Applying the earnings filter eliminates a large category of false positives.
- Following flow without GEX context. The same call sweep has very different follow-through probability in a positive vs. negative gamma regime. Acting on flow signals without checking the GEX regime adds unnecessary variance.
- Confusing sweeps with rolls. A volume spike across two expirations at the same strike is a roll — the institution is maintaining its existing position, not initiating a new one. The roll detection framework in the Order Flow guide prevents this common misclassification.
- Oversizing on high-conviction signals. Even a five-signal convergence with a golden sweep passing all three context filters fails 30–40% of the time. Position sizing discipline is non-negotiable regardless of signal quality.
UOA Detection in StrikeWatch EA
StrikeWatch EA provides a multi-layer UOA detection system that combines options flow data with structural context directly inside MetaTrader 5:
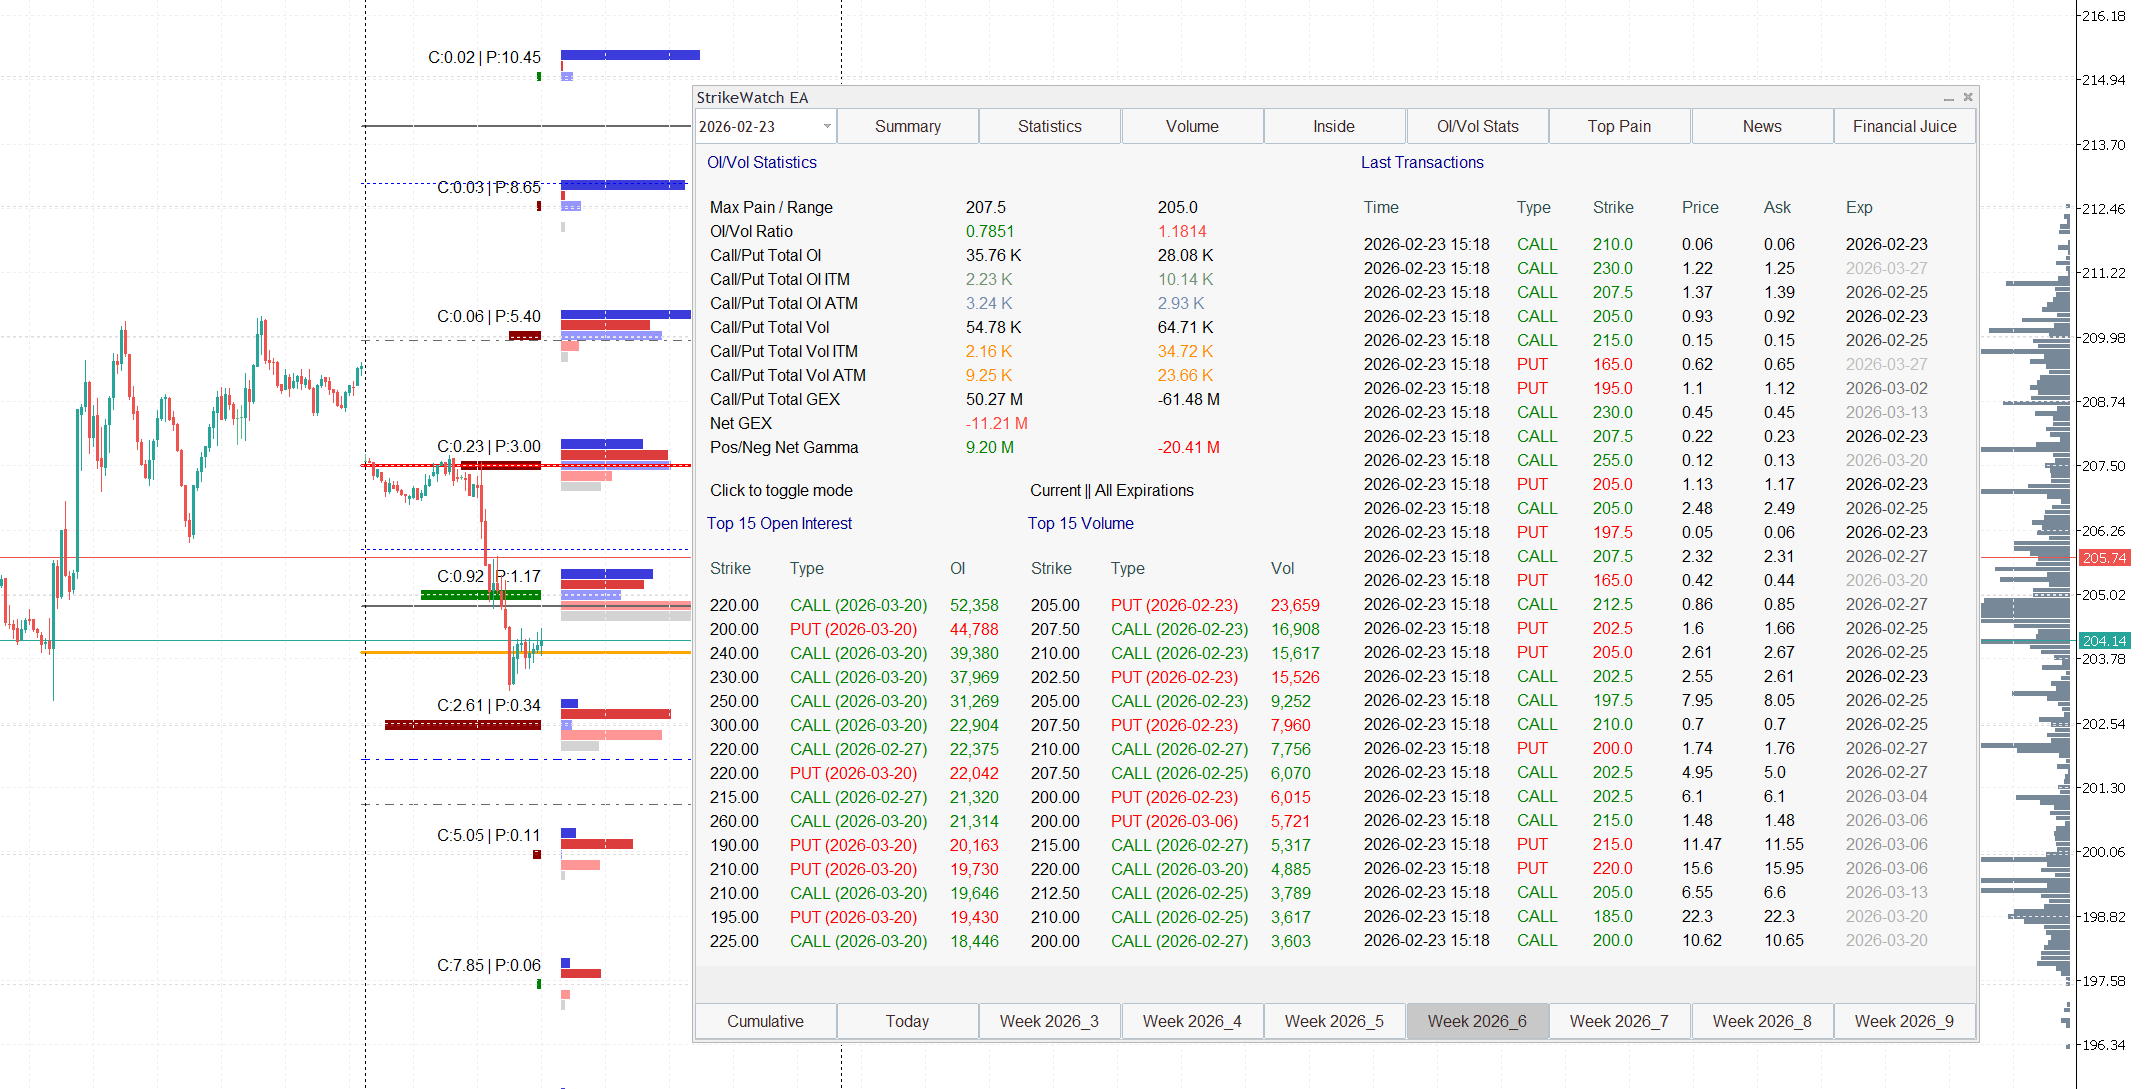
- OI/Volume Statistics — Real-Time Anomaly Flagging: When daily volume at a strike significantly exceeds its prior open interest, the module flags the V/OI ratio anomaly. The Top 15 Volume table surfaces the highest-activity strikes immediately, without manually scanning hundreds of rows.
- Real-Time Options Tape: The last 30 largest prints with timestamps, aggressor-side classification (ask vs. bid), premium size, and expiration. Clustered ask-side prints on the same strike within a short window are the primary golden sweep detection signal.
- GEX Regime Context: The GEX Profile and ZGL are displayed alongside the flow data — giving you the regime filter (positive vs. negative gamma) required for context filter #3 without switching between tools.
- OI Change Tracking: Comparing per-strike OI across sessions confirms whether yesterday’s high-volume strikes resulted in new positioning (OI rose) or liquidation (OI fell) — the essential next-day confirmation step for every UOA signal.
- Term Structure View for Roll Detection: Multi-expiration OI display reveals the simultaneous near-term decline + further-dated rise that identifies a roll — filtering it out of the actionable UOA signal set before false signals are acted on.
Volume spikes only become signals after OI confirmation. High
volume with rising OI = new positioning (actionable). High volume with flat/falling
OI = closing or rolling (not actionable for new entries). The OI change the next
morning is your confirmation gate.
Four order types, one hierarchy. Sweeps reveal urgency. Blocks
reveal strategic accumulation. Golden sweeps are the intersection of both plus
size. Dark pool combos are the hardest to detect but carry the highest
institutional scale. Prioritize in this order when multiple signals appear
simultaneously.
Five signals, three filters. Any single signal is noise. Three+
signals from the diagnostic table are a high-alert. All five signals + all three
context filters passing = maximum conviction setup. Never compress this process
under time pressure — false urgency is the primary destroyer of flow
analysis edge.
1–2% per trade, 50% stop, 100–200% target. The
sizing and exit rules are not conservative suggestions — they are the
mathematical requirement for surviving the 30–40% failure rate of even
the best UOA signals over a large sample. Discipline on these parameters is what
separates systematic flow trading from expensive noise-following.
Sector-level convergence amplifies single-stock signals. When
5+ stocks in the same sector show simultaneous UOA in the same direction, the
sector-level thesis is more reliable than any individual stock signal. ETF-level
flow (XLK, XLF, XLE) provides the macro confirmation layer.