What Is the Put/Call Ratio?
The Put/Call Ratio (PCR) is a market sentiment indicator that measures the relative activity of put options versus call options. It exists in two distinct forms that measure fundamentally different things:
Volume PCR = Put Volume ÷ Call Volume
OI PCR = Put Open Interest ÷ Call Open Interest
A PCR above 1.0 means more puts than calls — indicating bearish sentiment or hedging activity. Below 1.0 means more calls — indicating bullish sentiment or speculative optimism. The CBOE publishes aggregate PCR daily for total, equity, and index options separately.
The long-term average PCR for US equity options sits at approximately 0.70–0.80. This structural call bias reflects the fact that equity markets trend upward over time, making speculative call-buying the default mode for most participants. Understanding that 0.75 is “neutral” — not bearish — is the first step to reading PCR correctly.
Three Variants: Equity, Index, and Total PCR
The three standard variants measure different participant populations, carry different structural baselines, and should never be compared to each other’s thresholds:
| Variant | What It Measures | Structural Baseline | Dominated By | Best Signal For |
|---|---|---|---|---|
| Equity PCR | Individual stock options only | 0.60–0.80 | Retail + semi-institutional speculation, earnings plays | Broad retail sentiment; individual stock positioning; speculative extremes |
| Index PCR (CBOE SPX) | S&P 500 index options only | 1.00–2.00 | Institutional portfolio hedging; systematic put programs | Professional risk appetite; systematic hedging intensity; macro fear level |
| Total PCR | All options across all exchanges | 0.80–1.00 | Blended retail, institutional, speculative, and hedging activity | Broadest mood gauge; cross-check for equity vs. index divergence |
The index PCR is structurally higher because institutions routinely buy SPX puts for portfolio protection — this is systematic risk management, not directional bearishness. An index PCR of 1.5 is not panic; it is normal. The most valuable insight comes from comparing the two variants simultaneously: when equity PCR and index PCR diverge sharply, one participant group is repositioning while the other is not — and that divergence often precedes the larger move.
PCR as a Contrarian Indicator
The PCR’s greatest value is as a contrarian indicator. Options markets tend to reflect lagging sentiment — traders buy puts after prices fall and calls after prices rise. By the time sentiment reaches an extreme, the move that caused it is often near exhaustion.
- Very high PCR (> 1.0 equity, > 1.2 total): The crowd is aggressively buying puts. When everyone is already bearish and positioned defensively, selling pressure is exhausted. The marginal trade shifts from selling to covering. Extreme high PCR readings have historically preceded market rallies as shorts capitulate and hedges are lifted.
- Very low PCR (< 0.60 equity, < 0.70 total): The crowd is aggressively buying calls. When everyone is already positioned for upside, buying pressure is exhausted. Extreme low PCR readings have preceded corrections as late buyers run out of buyers above them.
The PCR is a confirming indicator, not a timing tool. An extreme reading tells you sentiment is stretched — not when the reversal will occur. The market can remain irrationally fearful or greedy longer than expected. Always combine PCR extremes with GEX regime context, price confirmation, or structural data from the Strike Wall Analysis framework before acting.
PCR Level Reference
| Equity PCR | Market Mood | Contrarian Signal | Historical Context |
|---|---|---|---|
| < 0.50 | Extreme optimism / euphoria | Strong sell signal — complacency peak | Rare; seen at major market tops (Jan 2021, late 2024 rally peaks) |
| 0.50–0.70 | Bullish / confident | Mild sell alert — optimism building | Common during uptrends; not actionable alone |
| 0.70–0.90 | Neutral / balanced | No signal — normal two-way market | Healthy baseline range for liquid equity markets |
| 0.90–1.10 | Cautious / fearful | Mild buy alert — pessimism building | Common during corrections; early fear stage |
| > 1.10 | Extreme fear / panic | Strong buy signal — capitulation likely | Major bottoms: March 2020, October 2022, August 2024 flash crash |
The 10-day and 21-day moving averages of the PCR are consistently more reliable than single-day readings. One large institutional hedge can spike the daily PCR without representing broad market sentiment. The 10-day MA crossing above 1.0 is a historically reliable warning of excessive fear and a signal to watch for reversal setups.
PCR vs. VIX: Complementary Angles on the Same Fear
The PCR and the VIX both measure market fear, but from fundamentally different inputs. The VIX measures the price of protection — how much implied volatility the market is paying. PCR measures the volume of protection — how many put contracts are being bought. Both can diverge meaningfully, and the divergence is often more informative than either measure alone:
| Feature | Put/Call Ratio | VIX |
|---|---|---|
| Measures | Volume or OI activity (quantity of protection) | Option prices (cost of protection) |
| Input data | Contracts traded or held (count-based) | Implied volatility from SPX options (price-based) |
| Scope flexibility | Per-strike, per-expiry, equity-only, or index-only | SPX-level only (VIX9D and VIX3M extend the term structure) |
| Key divergence signal | Rising PCR with stable VIX = volume fear building before price catches up | Rising VIX with stable PCR = priced-in fear without broad participation |
The most powerful confluence occurs when both PCR and VIX reach extremes simultaneously — equity PCR above 1.0 while VIX spikes above 30 signals genuine capitulation across both dimensions. Equally informative is divergence: PCR rising while VIX stays flat reveals retail fear building before the cost of protection has caught up — an early-warning pattern for an impending volatility expansion. For the full VIX framework, term structure, and vega filter methodology, see the VIX Explained guide.
Volume PCR vs. OI PCR: Two Different Signals
Most traders default to the volume-based PCR because it is what CBOE publishes daily. But the open interest-based PCR — the ratio of put OI to call OI at a given moment — tells a categorically different story. Understanding which signal you are reading prevents a systematic class of interpretation errors.
| Dimension | Volume PCR | Open Interest PCR |
|---|---|---|
| What it captures | Today’s activity — what traders are doing now | Cumulative positioning — what traders are currently holding |
| Time horizon | Intraday to 1-day | Days to weeks (structural) |
| Noise level | High — a single institutional block trade can swing it dramatically | Low — changes slowly as positions are opened and closed over multiple sessions |
| 0DTE distortion | High — 0DTE call-heavy volume artificially depresses daily reading | Minimal — 0DTE contracts expire same-day and leave almost no overnight OI |
| Best use | Short-term sentiment pulse; event-day hedging surge detection; intraday fear/greed | Structural regime analysis; detecting systematic put accumulation across sessions |
Reading Volume/OI PCR Divergences
The most informative PCR signals come not from either measure in isolation, but from their relationship:
- High Volume PCR but stable OI PCR: A single-session hedging surge without structural follow-through. Someone bought puts aggressively today but the broader positioning has not shifted. This is often an event-specific hedge — treat as noise unless the OI PCR begins trending upward in subsequent sessions.
- Rising OI PCR across multiple sessions with moderate Volume PCR: Systematic put accumulation — new positions are being opened consistently without panic buying. This is the institutional pattern: methodical increase in downside protection while public attention is elsewhere. A rising OI PCR over 5–10 sessions is a significantly more bearish structural signal than any single-day volume spike.
- Falling Volume PCR while OI PCR remains elevated: Existing put hedges are being held but no new ones are being added. The market is maintaining a defensive posture without escalating — a “wait and see” pattern that often precedes resolution in either direction. This configuration reduces the contrarian buy signal strength compared to a full capitulation where both measures spike simultaneously.
PCR Term Structure: Reading Cross-Expiry Sentiment
Just as the IV term structure reveals how implied volatility varies across expirations, the PCR term structure — the Put/Call Ratio measured separately for near-dated, intermediate, and long-dated expirations — reveals whether fear is event-specific or structural in nature.
| PCR Term Structure Shape | Near-Term PCR | Long-Dated PCR | Interpretation | Contrarian Implication |
|---|---|---|---|---|
| Elevated front, stable back | High (> 1.0) | Normal (0.7–0.9) | Event-specific fear: market fears an imminent catalyst but trusts longer-term conditions | Post-event recovery trade. Once the catalyst resolves, near-term put demand collapses. Mirrors IV term structure backwardation in its setup logic. |
| Uniformly elevated across all maturities | High (> 1.0) | High (> 0.9) | Structural regime concern: put buying reflects broad de-risking across time horizons, not a single catalyst | Caution. Structural elevated PCR can persist through multi-week downtrends. Require additional GEX regime confirmation before fading. |
| Inverted: near < far | Normal (0.6–0.8) | Elevated (> 0.9) | Institutional long-dated protection accumulation: smart money is hedging multi-month horizons while the short-term appears calm | High-conviction medium-term warning. When this appears during a bull market rally, it frequently precedes a regime shift. Price may still rise short-term but the informed-money signal is in place. |
The inverted PCR term structure deserves particular attention. When long-dated put buying is elevated while near-term PCR remains calm, institutions are purchasing protection that expires months from now — a deliberate act of medium-term risk management, not reactive hedging. Retail traders rarely buy three-to-six-month puts; institutions do systematically. An inverted PCR term structure during an otherwise bullish equity environment is one of the most reliable leading indicators of a coming regime shift.
These two term structures are related but distinct. The IV term structure shows what the market is pricing for protection. The PCR term structure shows what traders are actually buying. When they diverge — IV term structure is calm while PCR term structure shows long-dated put accumulation — the PCR divergence reveals positioning that has not yet been reflected in option prices. That gap is the informational edge.
Per-Strike PCR: Precision Beyond the Aggregate
The aggregate market PCR is a blunt instrument. Far more actionable is the per-strike Put/Call Ratio — the ratio of put-to-call volume or OI at each individual strike. A strike with PCR > 2.0 is heavily put-weighted, acting mechanically as a support floor. A strike with PCR < 0.5 is call-heavy, acting as a resistance ceiling. An intraday PCR shift at a specific strike — moving from 0.5 to 3.0 mid-session — signals a sudden surge in put buying at that price, potentially indicating institutional hedging establishing a new structural level in real time.
Per-strike PCR is one of the four structural layers in the Strike Wall Analysis framework, where it provides the directional character (floor vs. ceiling) that converts raw OI into a mechanical support or resistance score. The dealer-hedging mechanics that make high put OI at a strike a genuine floor — dealers buying the underlying to stay delta-neutral as price approaches — are covered fully in the Max Pain guide.
PCR and GEX: When Sentiment Meets Structure
The PCR tells you what the crowd believes. GEX tells you what the market is mechanically forced to do. The two layers are independent and sometimes contradictory — their interaction separates high-conviction setups from noise:
| PCR Signal | GEX Regime | Combined Interpretation | Trade Implication |
|---|---|---|---|
| High PCR (fear) | Positive GEX (above ZGL) | Fear is elevated but dealers are mechanically absorbing selling. The crowd is bearish, but structure is supportive. | Highest-conviction contrarian long. Fear exhaustion + mechanical floor. Classic premium-selling or mean-reversion entry. |
| High PCR (fear) | Negative GEX (below ZGL) | Fear may be prescient, not panicked. Dealers are amplifying moves rather than absorbing them. | Do not fade. Confirm GEX regime flip before considering any counter-trend position. The put buyers may be right. |
| Low PCR (greed) | Positive GEX (above ZGL) | Complacency in a stable regime. Low volatility, call-heavy positioning in a market mechanically capped by dealer hedging. | Ideal premium-selling environment. Watch ZGL proximity — complacency near the flip level is the complacency trap. |
| Low PCR (greed) | Negative GEX (below ZGL) | Complacency in an amplifying regime — the most dangerous combination. Everyone is positioned for upside while dealer hedging can mechanically accelerate a reversal. | High alert. Reduce long exposure; consider defined-risk hedges. This combination has historically preceded sharp, fast corrections. |
The full integration of PCR into a structural scoring framework alongside OI concentration, GEX, and Max Pain — including the four-layer wall scoring system, live vs. dead wall classification, and pre-market workflow — is covered in the Strike Wall Analysis hub article.
PCR Through Market Cycles
Interpreting PCR against a static threshold rather than a cycle-adjusted baseline is the most common source of false signals:
- Bull market: PCR trends structurally lower as call volume increases. A “normal” equity PCR during a bull may be 0.55–0.65 rather than the long-term 0.70–0.80 average. A reading of 0.80 carries mild bearish signal value that the same reading would not carry in a neutral market. Recalibrate thresholds against the trailing 6-month baseline, not the all-time average.
- Bear market: PCR trends higher. A “normal” bear-market PCR may be 0.90–1.10. A reading of 1.0 is not extreme — it is the prevailing state. The contrarian signal during a bear is a sharp drop in PCR (short-covering rally, not capitulation) rather than an elevated reading, which is the default.
- Transition periods: PCR divergence from price is the most valuable signal. A rising PCR during a bull market (sentiment deteriorating despite rising prices) is an early warning. A falling PCR during a bear (sentiment improving despite falling prices) signals that capitulation may be forming.
- 0DTE distortion (post-2022): The explosion of 0DTE options trading — representing over 60% of daily SPX volume — has added structural noise to daily PCR readings. 0DTE volume is predominantly speculative and call-heavy (directional buyers seeking intraday leverage), which artificially depresses the aggregate daily PCR regardless of broader market sentiment. Three practical adjustments: (1) use the 21-day moving average to smooth intraday noise; (2) switch to OI-based PCR, since 0DTE contracts generate almost no overnight OI; (3) when using volume PCR, compare only to post-2022 baselines — pre-2022 thresholds are structurally uncalibrated to the current market.
Common PCR Mistakes
- Acting on a single day’s volume PCR. Daily readings are noisy. One large institutional hedge can spike the PCR without representing broad market sentiment. Use the 10-day or 21-day moving average as the primary signal.
- Comparing equity PCR to index PCR thresholds. An equity PCR of 1.0 signals extreme fear. An index PCR of 1.0 is entirely normal. Always compare each variant to its own historical baseline.
- Ignoring OI PCR alongside volume PCR. Volume spikes without OI confirmation are transient. Sustained OI PCR trends are structural. Using only one measure misses the Volume/OI divergence patterns described in Section 6 — which include the most reliable institutional positioning signals.
- Using PCR as a standalone timing tool. PCR identifies sentiment extremes, not reversal timing. Without GEX regime context or structural wall confirmation, a “high fear” PCR reading can remain elevated for weeks while price continues lower.
- Ignoring the cause of put buying. Not all put buying is bearish. Portfolio hedging, collar construction, and married puts generate put volume without directional intent. Per-strike analysis distinguishes speculative puts (OTM, specific strikes) from hedging puts (near-ATM or at portfolio beta-weighted levels).
- Applying pre-2022 thresholds post-0DTE era. The 0DTE call-volume effect has permanently shifted the daily PCR baseline downward. A reading of 0.65 in 2025 is structurally different from the same reading in 2019. Use post-2022 rolling baselines or switch to OI PCR for historical comparability.
- Ignoring PCR term structure. The aggregate daily PCR cannot distinguish event-specific near-term fear (which resolves quickly) from structural long-dated put accumulation (which signals a regime shift). The cross-expiry PCR pattern described in Section 7 provides this distinction — and is the most systematically under-utilized dimension of PCR analysis.
Put/Call Data in StrikeWatch EA
StrikeWatch EA provides granular put/call analysis that goes far beyond the aggregate CBOE ratio — delivering per-strike and structural PCR data directly inside MetaTrader 5:
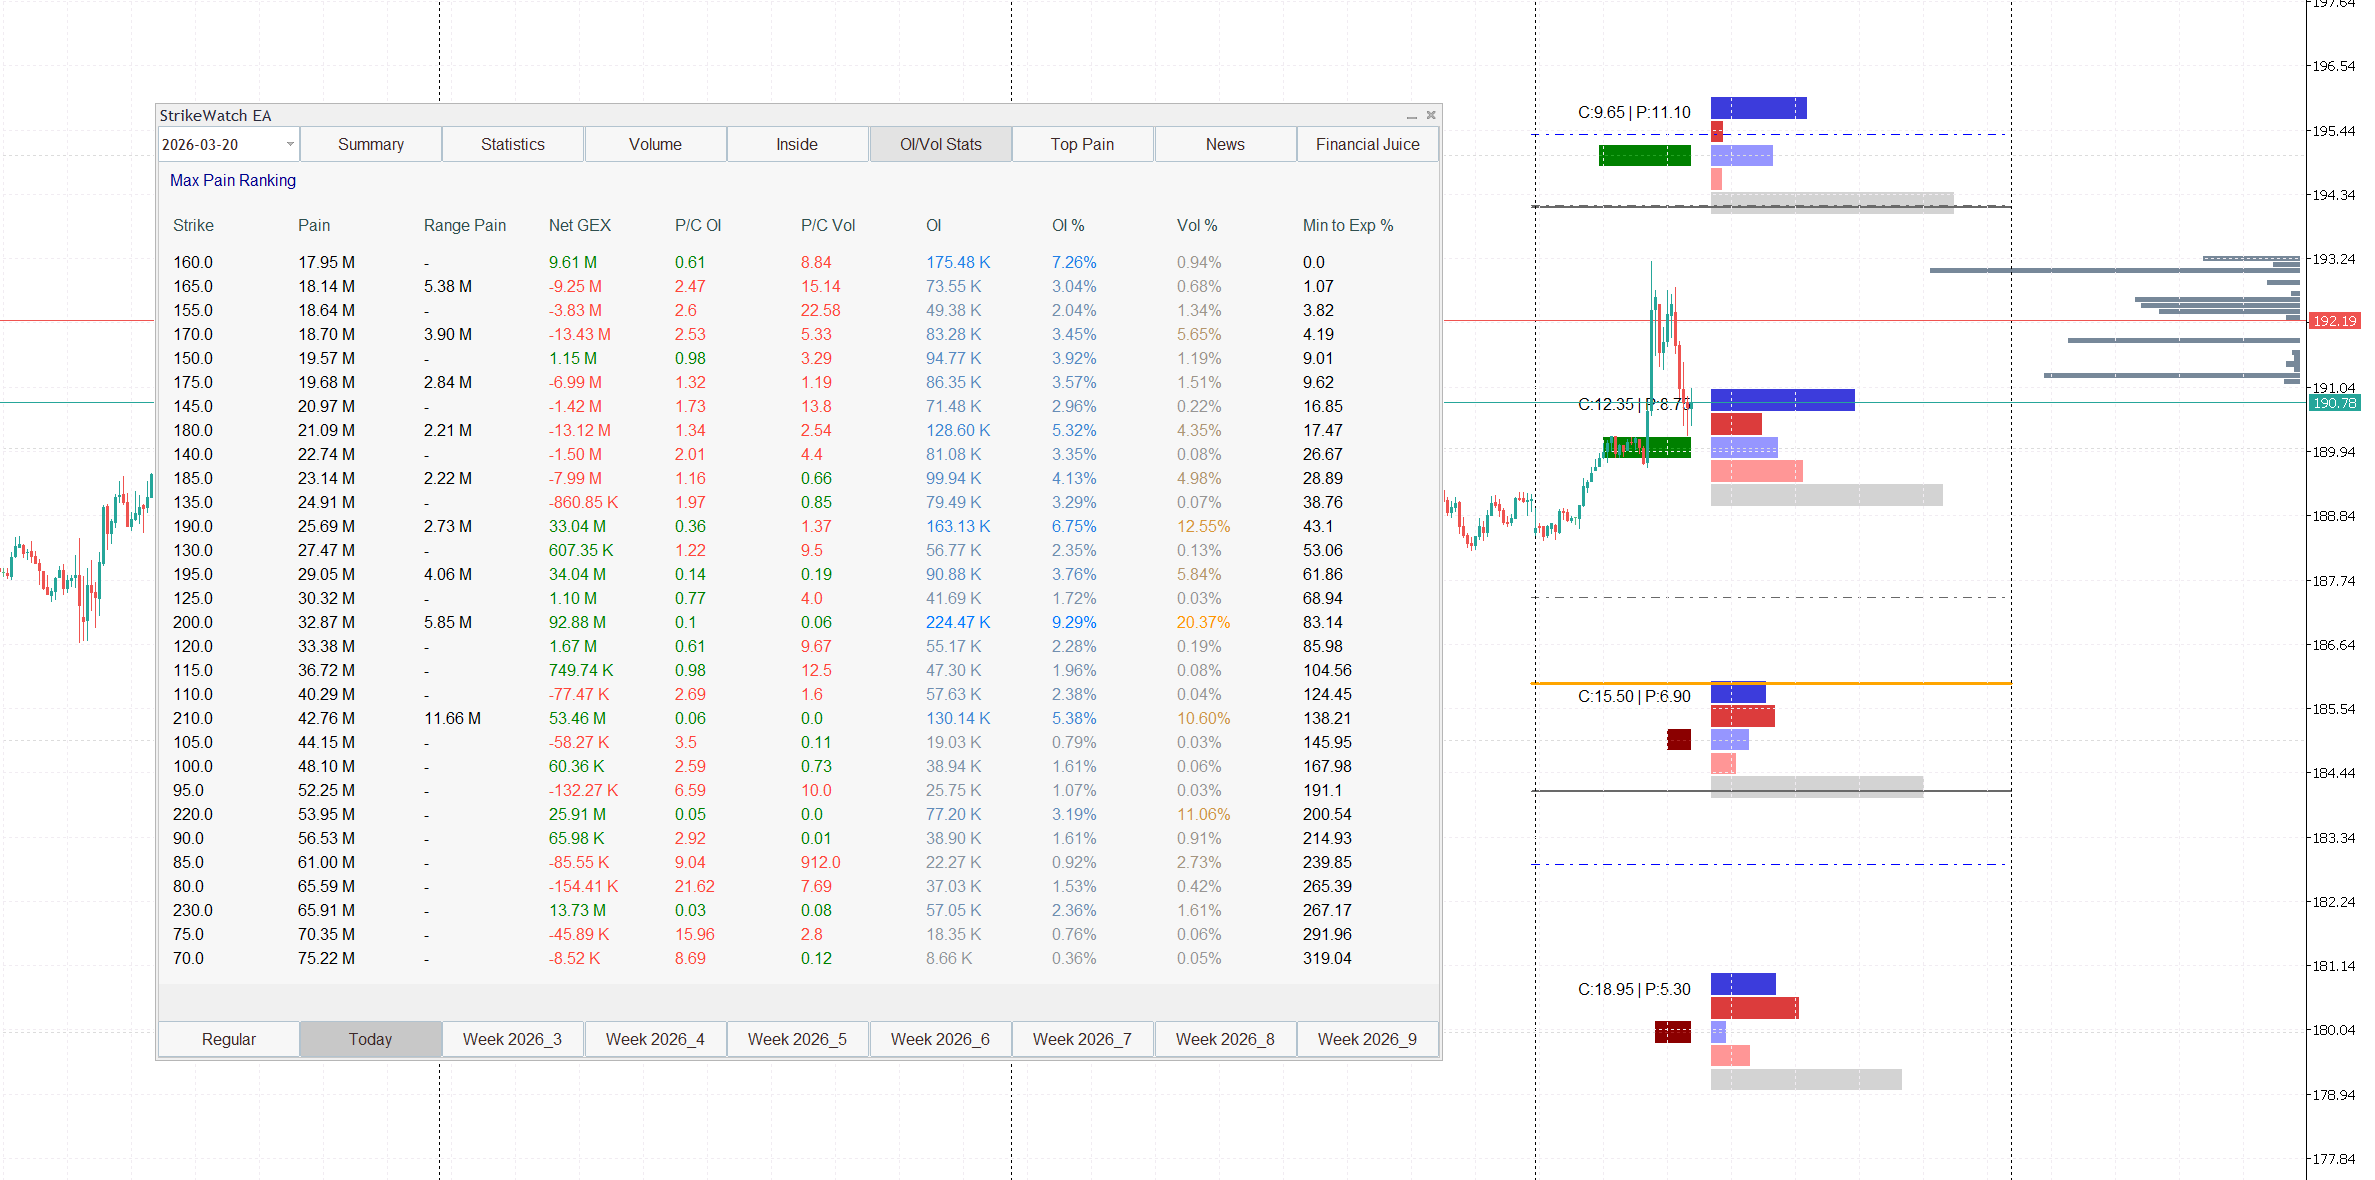
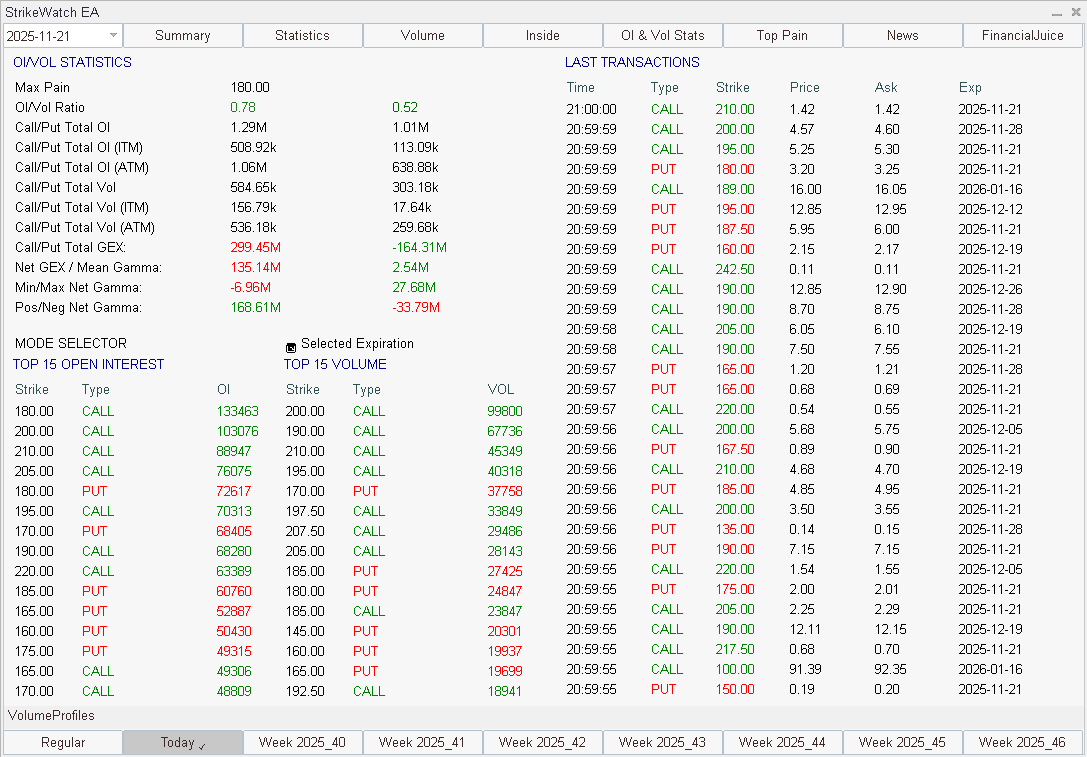
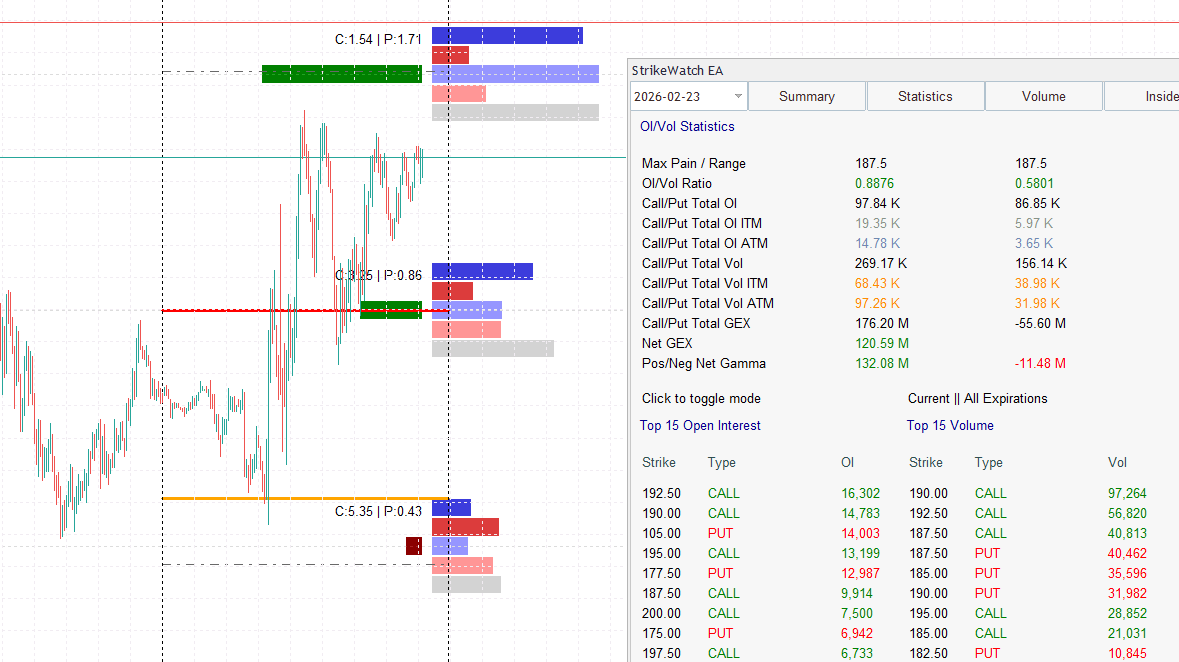
- OI/Volume Statistics — Per-Strike PCR: The Top 15 Strikes module displays put and call volume and open interest at each of the most active strikes — providing both Volume PCR and OI PCR per strike simultaneously. A divergence between the two at a specific strike immediately reveals whether elevated put activity is structural (rising OI PCR) or transient (volume spike without OI confirmation).
- GEX Profile integration: The GEX histogram shows how put and call gamma at each strike creates mechanical effects. When per-strike PCR is high (put-heavy) at a level that also shows a dominant positive GEX bar, you have both sentiment confirmation and mechanical structural support — the highest-conviction floor identification in the framework. Full GEX regime mechanics in Dealer Hedging Regimes: GEX and the Zero Gamma Level.
- Max Pain alignment: The Max Pain level inherently reflects the OI PCR balance across the entire strike chain. When the Max Pain strike shifts during the week, it reveals that the structural put/call OI balance has changed — a macro-level PCR shift made visible through expiration mechanics. Full mechanics in the Max Pain guide.
- Dynamic Term Structure Heatmap: By viewing OI and volume per expiration in the Term Structure module, traders can construct the PCR term structure described in Section 7 — identifying whether put accumulation is concentrated in near-term expirations (event fear) or spread across the curve (structural concern).
Volume PCR measures activity; OI PCR measures commitment. A spike in Volume
PCR without OI confirmation is transient. A multi-session rise in OI PCR is structural —
and a more reliable bearish signal than any single panic day.
PCR term structure reveals intent. Near-term put elevation = event fear
(resolves post-catalyst). Long-dated put accumulation during a bull market = institutional
de-risking, a leading indicator of regime change that the aggregate PCR cannot show.
PCR alone does not time reversals. Combine with
GEX regime using the 2×2
table in Section 9, and with per-strike structural data from the
Strike Wall scoring framework for
actionable, high-conviction setups.
The 0DTE era has permanently shifted daily PCR baselines. Post-2022, use the
21-day moving average, OI PCR, or post-2022 rolling thresholds — never raw daily PCR
against pre-2022 benchmarks.
Per-strike PCR is PCR’s most actionable form. Aggregate PCR tells you
the mood; per-strike PCR tells you exactly where that mood is concentrated on the price chart.