What Are Gamma Exposure and the Zero Gamma Level?
Gamma Exposure (GEX) and the Zero Gamma Level (ZGL) are two parts of the same structural framework. GEX measures how much dealer delta exposure changes as the underlying moves. The ZGL marks the price level where that aggregate dealer gamma book flips from positive to negative.
Together, they explain why some sessions remain compressed, rotational, and orderly while others turn unstable, directional, and violent. Price shows the result. Dealer hedging explains the cause.
Positive gamma: dealers tend to buy dips and sell rallies, which suppresses volatility.
Negative gamma: dealers tend to sell weakness and buy strength, which amplifies volatility.
The ZGL is the threshold where the market flips between those two regimes.
Why Dealer Hedging Matters
To understand GEX, you need two building blocks from options theory: Delta, which measures how much an option price changes for a $1 move in the underlying, and Gamma, which measures how much delta itself changes as the underlying moves.
Dealers who sell options inherit changing delta exposure as price moves. To stay approximately delta-neutral, they continuously buy or sell the underlying. This process is known as delta-hedging. Once scaled across thousands of contracts and many strikes, it creates mechanical flows that can dominate short-term price action.
These flows often have nothing to do with fundamentals, discretionary sentiment, or chart patterns. They are structural. That is why nearly identical headlines can produce completely different intraday behavior in different gamma regimes.
The Mechanics of Delta-Hedging
Imagine a dealer sells a call option at the $500 strike while the stock trades at $490. If the call has a delta of 0.30, the dealer is effectively short 30 shares per contract and may buy 30 shares to hedge. If the stock rises and gamma pushes that delta to 0.38, the dealer needs to buy more shares to stay hedged. If the stock falls again, part of that hedge is sold back.
In isolation this looks simple. In aggregate it becomes a market force. Across many strikes and expirations, those small rebalancing adjustments create persistent supply and demand in the underlying. That is the real foundation of GEX analysis.
How Gamma Exposure Is Calculated
At the strike level, GEX is typically expressed by combining option gamma, open interest, the contract multiplier, and spot-price scaling so the output reflects dollar-denominated hedging sensitivity.
GEXK,T = Gamma × Open Interest × Contract Multiplier × Spot Price²
— Standard market-maker gamma aggregation framework used to estimate how aggressively delta exposure changes for each $1 move in the underlying.
The market-level profile is then created by summing those contributions across strikes and expirations. What matters most in practice is not one isolated strike but the full gamma landscape: where the largest positive and negative concentrations sit, how close spot is to them, and which expiration is driving the current profile.
| Strike | Type | Open Interest | Gamma | GEX Contribution | Typical Effect |
|---|---|---|---|---|---|
| $490 | Call | 12,500 | 0.045 | +$27.5M | Supports mean reversion |
| $490 | Put | 8,200 | 0.038 | −$15.6M | Adds downside instability |
| $500 | Call | 22,000 | 0.052 | +$57.2M | Acts as a gravity or pinning zone |
| $480 | Put | 18,500 | 0.029 | −$26.9M | Can accelerate breakdowns |
What the Zero Gamma Level Actually Means
The Zero Gamma Level, also called the gamma-neutral price, the volatility trigger, or the flip level, is the price where aggregate net gamma exposure crosses zero. It is the break-even point of the dealer community's collective gamma book.
When total GEX is positive, dealer delta-hedging is stabilizing: they buy dips and sell rallies. When total GEX turns negative, that same hedging becomes destabilizing: dealers sell dips and buy rallies, amplifying directional movement. The ZGL is the threshold where that polarity changes.
ZGL = P* such that: Σ GEXcall(P*) + Σ GEXput(P*) = 0
— The ZGL is the zero-crossing of the full net GEX profile, typically estimated by interpolating between nearby prices where aggregate gamma changes sign.
Because option gamma peaks near ATM and collapses deep ITM or OTM, the profile is non-linear. The ZGL is therefore not a simple midpoint between the largest call strike and the largest put strike. It is the output of a full repricing of the gamma surface at each candidate spot level.
The ZGL is not fixed. It updates as open interest changes, contracts decay, and positions are rolled. In active names, that makes it one of the most important live structural levels on the chart.
Positive Gamma Regime: Price Above the ZGL
When price trades above the ZGL, dealer hedging usually acts as a negative feedback loop. As the market rises, dealers tend to sell underlying to stay hedged. As it falls, they tend to buy underlying. This behavior dampens directional movement.
The result is a market that often feels rotational and sticky. Intraday ranges compress, volatility tends to stay contained, and price frequently gravitates back toward dominant positive-gamma strike clusters. This is the environment where mean-reversion strategies tend to outperform momentum setups.
Typical characteristics above the ZGL
- Breakouts are more likely to fail or fade.
- Intraday ranges tend to compress.
- Volatility often drifts lower or remains anchored.
- High positive-GEX strikes can behave like magnets into expiration.
- Short-dated premium-selling structures generally have a better backdrop.
Negative Gamma Regime: Price Below the ZGL
When price moves below the ZGL, dealer hedging tends to become a positive feedback loop. As downside extends, dealers may need to sell more underlying to re-hedge. As the market rebounds, they may have to buy back exposure more aggressively. Both sides can intensify the move.
The result is a market with wider ranges, sharper reversals, and more unstable trend development. This is the regime where momentum can work extremely well, but where risk also rises sharply for anyone using tight stops or short-volatility structures.
Typical characteristics below the ZGL
- Directional moves extend farther and faster.
- Gap-and-go sessions become more common.
- Realized and implied volatility tend to rise.
- Stops need to be wider than usual.
- Naked short premium becomes structurally more dangerous.
| Market Condition | Regime | Dealer Hedging | Volatility Profile | Preferred Bias |
|---|---|---|---|---|
| Price well above ZGL (>3%) | Strong Positive Gamma | Strong stabilizing flow | Compressed, VIX often softer | Fade moves, sell premium selectively |
| Price near ZGL (±0.5%) | Transitional Zone | Minimal or unstable | Elevated and unpredictable | Reduce size, wait for clarity |
| Price just below ZGL | Mild Negative Gamma | Mild amplification | Expanding | Favor directional trades |
| Price far below ZGL (>3%) | Strong Negative Gamma | Strong amplification | Explosive, gaps common | Trend-follow, long vol |
| ZGL upside re-cross | Regime Recovery | Flip back to stabilizing | IV crush often follows | Reduce long-vol bias, consider vol sales |
The ZGL as a Forward-Looking Volatility Trigger
One of the most important properties of the ZGL is that it is forward-looking. Unlike reactive measures such as VIX, which reflect what options are currently pricing, the ZGL tells you where dealer hedging mechanics are likely to change before price gets there.
That makes the ZGL an early-warning system. If the market is comfortably above it, you should be skeptical of sustained directional continuation. If price is approaching it from above, you should be alert for fragility. If price is already cleanly below it, you should assume the environment can remain unstable longer than chart-only traders expect.
The Distance-to-ZGL Metric
The percentage distance between current price and the ZGL is one of the most useful regime-stress gauges available to an options-aware trader. When price is 3–4% above the ZGL, the market is usually deeply embedded in positive gamma and the odds of a same-session regime flip are relatively low. When price is within roughly 0.5% of the ZGL, sensitivity rises sharply: a single catalyst, flow imbalance, or liquidity vacuum can flip dealer behavior intraday.
Checking the spot-to-ZGL distance before the open is one of the highest-value habits in structural market analysis. It helps distinguish a stable session from one that only looks stable.
ZGL Versus VIX: Two Different Clocks
The VIX measures current implied volatility, or what the options market is pricing for future realized volatility. The ZGL measures structural dealer positioning, or where hedging mechanics will change character. These are not substitutes.
In practice, the most dangerous blind spot appears when VIX is low and price is quietly drifting toward the ZGL from above. That combination can create a complacency trap: premium sellers see low IV, but structural positioning is becoming more fragile underneath the surface. Monitoring both metrics together provides a much cleaner view of regime risk.
Empirical Behavior After a ZGL Break
In practice, confirmed breaks below the ZGL often matter more than traders initially assume. Once price closes below the threshold and remains there, the market frequently enters a multi-session window of elevated realized volatility and stronger directional persistence.
- Regime persistence: A confirmed downside break of the ZGL often persists for several sessions rather than resolving immediately. This gives traders a broader directional window than a single intraday breakout signal would suggest.
- Volatility asymmetry: Realized volatility after a downside flip is typically much higher than during the prior positive-gamma regime. The expansion is often most visible in heavily traded large-cap names with concentrated options activity.
- Recovery dynamics: When price reclaims the ZGL from below, implied volatility often compresses quickly as dealers unwind protective hedges and the market transitions back toward a stabilizing structure.
- OPEX sensitivity: These transitions are usually most violent in the final stretch before expiration, when gamma values are largest and hedging sensitivity is highest.
The point is not that every ZGL breach produces the same statistical outcome. The point is that the regime threshold has repeatable structural consequences, especially in crowded names and near expiration.
How to Use GEX and the ZGL in Practice
GEX and the ZGL are most useful when they shape your interpretation of every other signal rather than acting as isolated triggers. First define the environment. Then choose the trade.
- Start with regime identification. Before taking any trade, determine whether price is above or below the ZGL. This immediately tells you whether to prefer mean reversion or momentum.
- Map major gamma strikes. Identify the largest positive and negative GEX concentrations. Positive clusters often act as gravity zones, while negative clusters can act as acceleration zones.
- Adjust for expiration timing. Gamma matters most near expiration, especially during 0DTE, weeklies, and the final stretch into monthly OPEX.
- Use the ZGL as a transition threshold. If price is approaching the ZGL, expect greater regime fragility. If price confirms a break below, prepare for larger realized volatility.
- Look for confluence. The strongest setups appear when gamma structure aligns with open-interest concentration, expected move, tape imbalance, or volume-profile levels.
A Practical Trading Framework Around the ZGL
The ZGL is not a trade signal in isolation. It defines the environment in which other signals should be interpreted. A practical framework looks like this:
- Morning regime check: Before the open, note the ZGL and current pre-market price. Are you in positive or negative gamma? How far is spot from the ZGL? This single step reframes your session bias before the first candle prints.
- Positive gamma playbook: Favor mean reversion. Use high positive-GEX strikes as support and resistance. Keep directional expectations modest and assume breakouts may fail.
- Negative gamma playbook: Favor momentum and continuation. Widen stops, reduce size, and avoid structurally fragile short-vol positions.
- ZGL approach setup: When price is within roughly 0.5% of the ZGL, sensitivity is high. A confirmed break can trigger fast range expansion, while a clean rejection can send price back toward the dominant positive-gamma cluster.
- Re-cross volatility framework: When price reclaims the ZGL after a negative-gamma period, it often marks the start of IV compression and a more favorable backdrop for volatility sales.
Common Misconceptions and Trading Errors
GEX and the ZGL are powerful, but they are also frequently misused. Most mistakes happen when traders treat them as simple directional indicators instead of structural regime tools.
- Treating GEX as directional: GEX tells you more about the behavior of price than its outright direction. Negative gamma can produce both violent selloffs and violent squeezes.
- Treating a single intraday breach as a confirmed regime flip: Intraday wicks below the ZGL happen frequently. A more credible shift usually requires a meaningful close below the level and stronger participation than a random liquidity sweep.
- Ignoring expiration weighting: Front-week and near-expiration contracts often dominate the actual hedging effect. A blended all-expiration number can hide what matters most in the current session.
- Ignoring ZGL drift: The level changes as positions are opened, closed, rolled, and decayed. A stale value is often less useful than traders think.
- Applying single-stock logic directly to indices: Index gamma reflects a broader and more diffuse hedging ecosystem. The effect is still real, but it is often cleaner and more tradeable in single names with concentrated options activity.
- Ignoring earnings-window distortions: Pre-earnings implied-volatility inflation can temporarily reshape ATM gamma and displace the apparent ZGL. Post-earnings IV crush can then rapidly normalize the structure and create false-looking regime signals.
- Assuming raw open interest perfectly reflects dealer positioning: Open interest is informative, but not infallible. It is strongest when combined with flow and broader context.
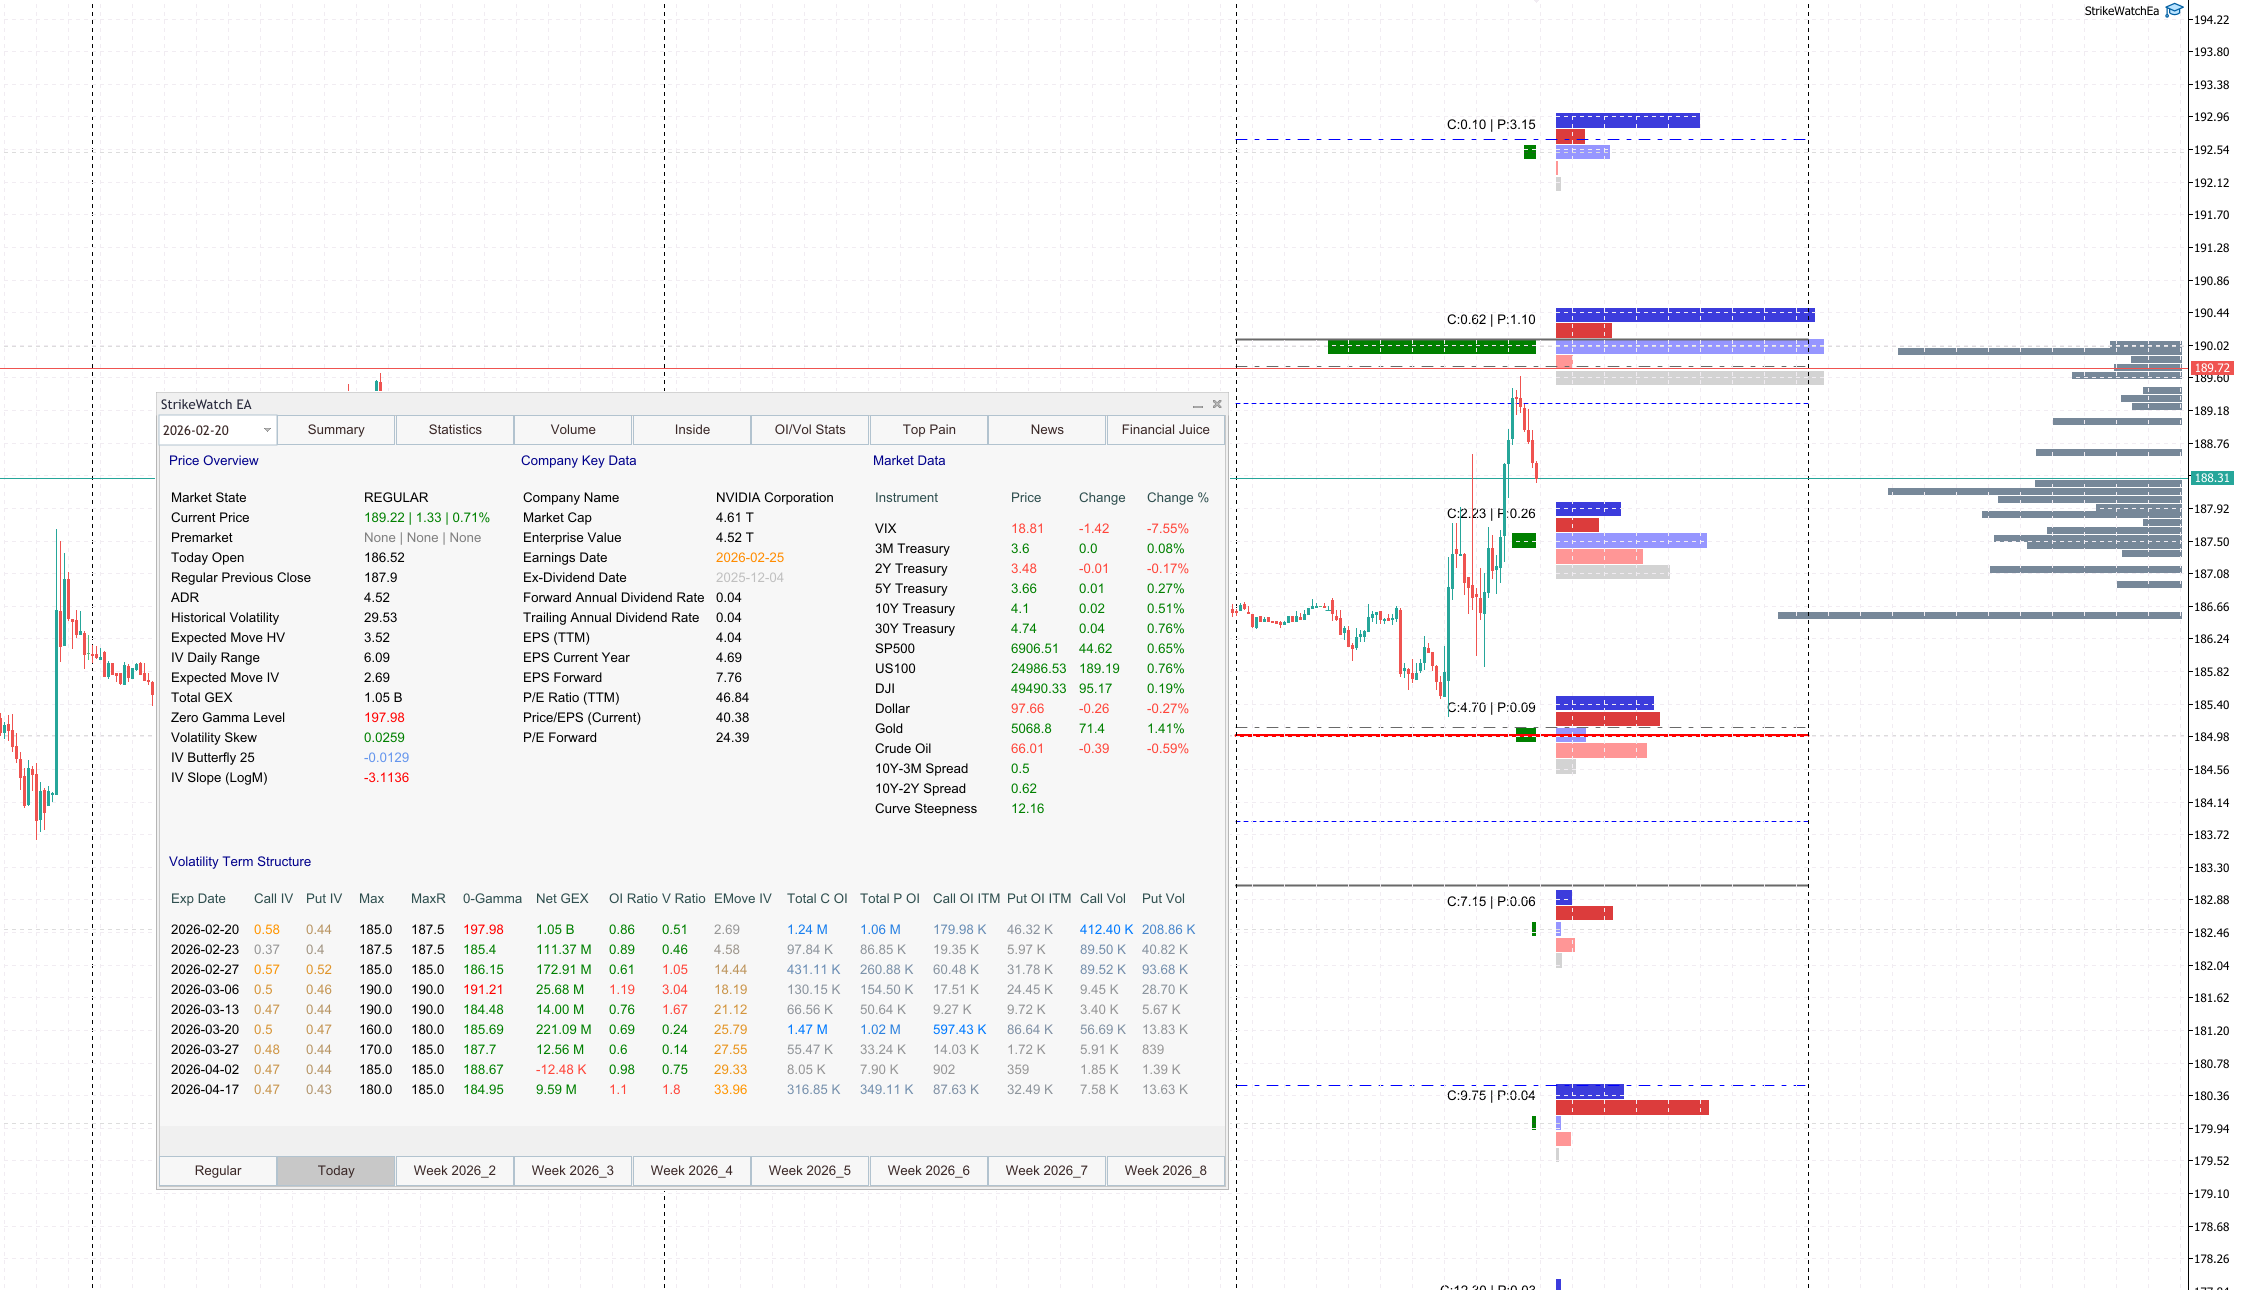
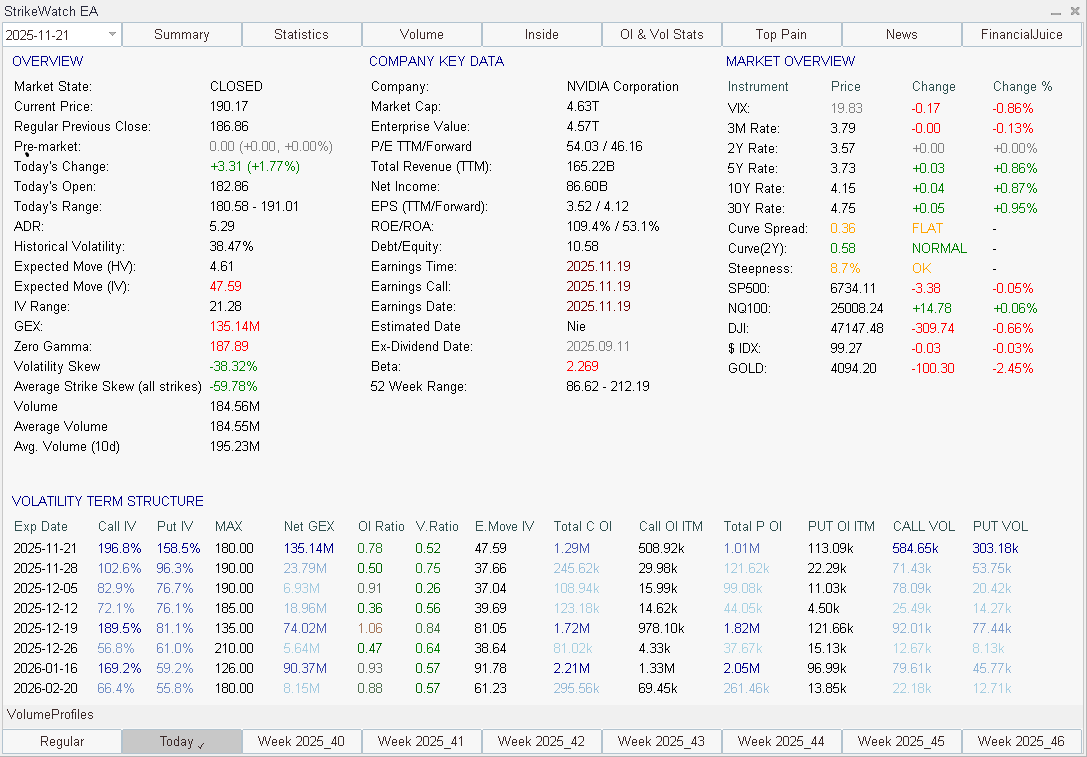
How StrikeWatch EA Displays GEX and the ZGL
StrikeWatch EA is designed so traders never need to calculate these values manually. Both the shape of the gamma landscape and the regime threshold are surfaced directly inside MetaTrader 5.
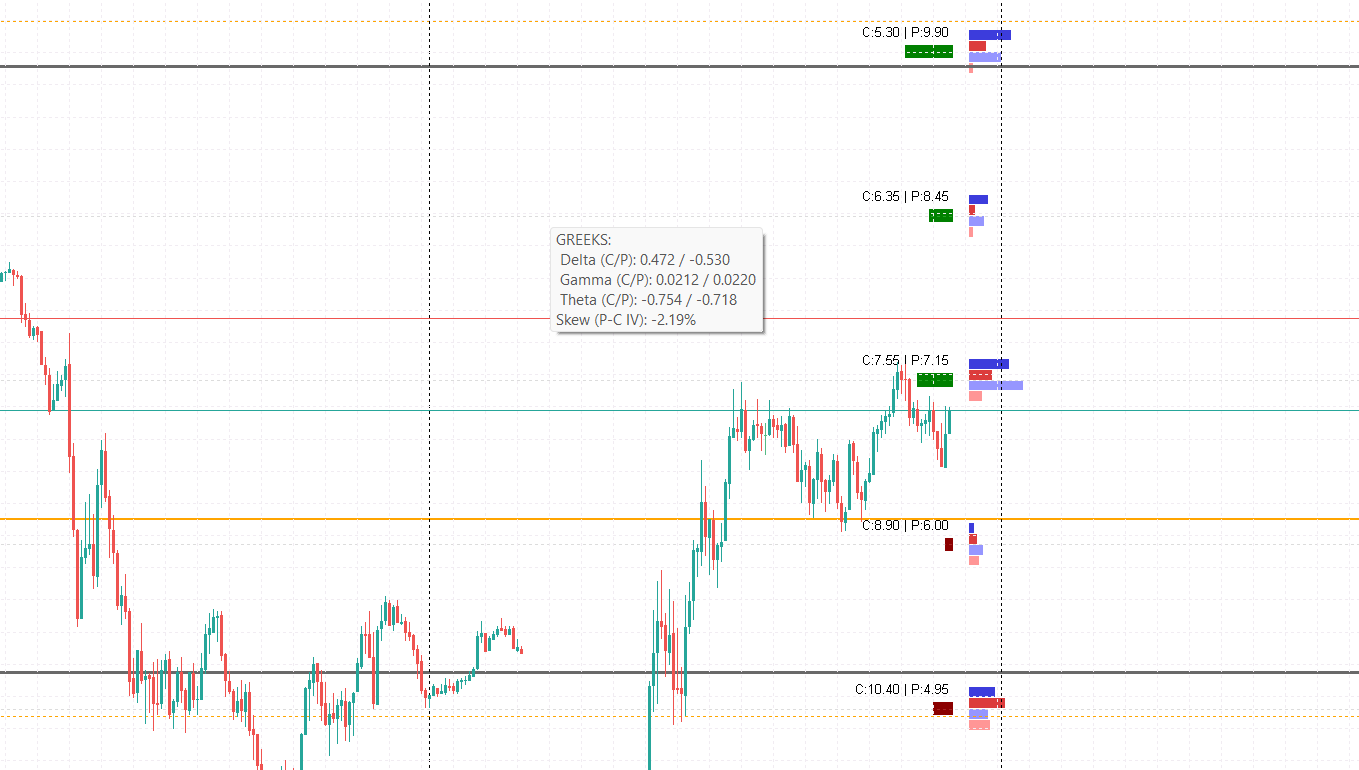
- On-chart Net GEX Profile: Horizontal bars show positive and negative gamma concentration by strike directly on the price chart.
- Dynamic ZGL line: The Zero Gamma Level is plotted as a live structural threshold on MT5.
- Summary Surface module: Net GEX, the ZGL, and broader volatility context are displayed in one place for fast regime assessment.
- Distance-to-ZGL readout: Traders can immediately see how far spot is from the flip level in both dollar and percentage terms.
- Regime color signal: When net gamma flips from positive to negative or back again, the interface changes state visually so the regime transition is immediately obvious.
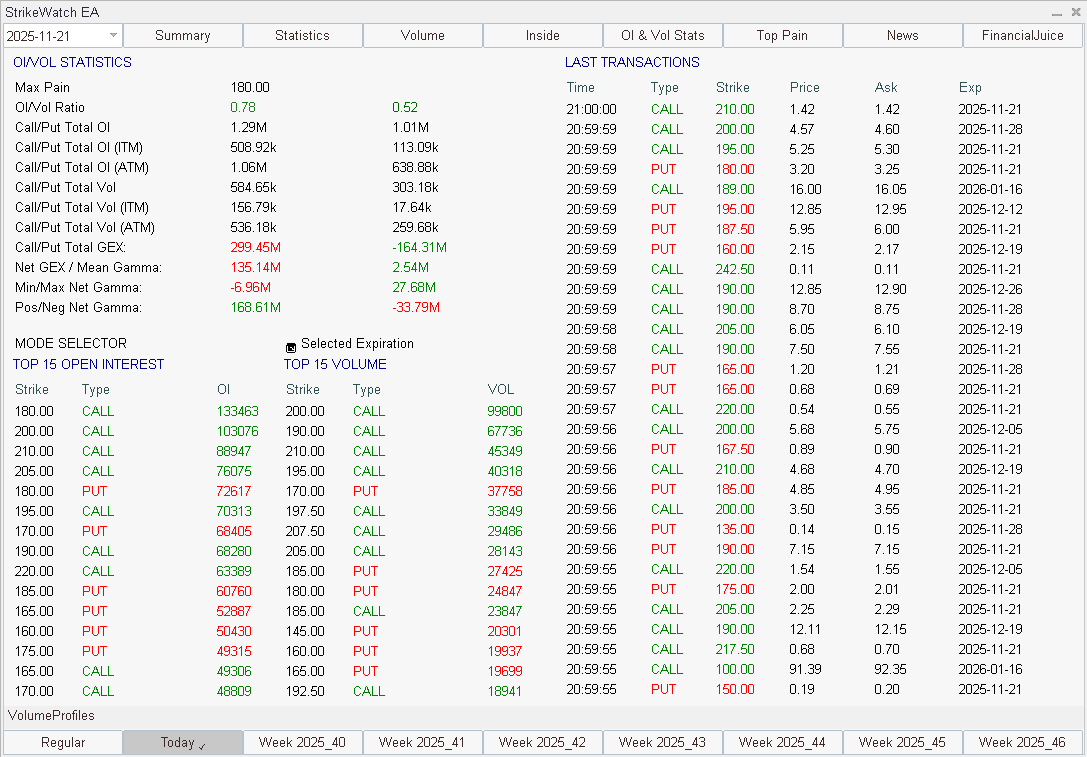
- OI/Volume Statistics module: Major gamma strikes can be evaluated alongside open interest, volume, and related structural context.
- Multi-expiration analysis: Traders can distinguish between front-week gamma structure and broader composite positioning across expirations.
- Composite versus near-term ZGL: This separation helps identify when the front-week structure is far more fragile than the broader all-expiration profile suggests.
- Strike Wall integration: GEX regime and ZGL position are the mandatory first inputs in the Strike Wall scoring workflow — the regime determines whether a structural wall will be mechanically defended by dealer flows or bypassed under momentum conditions.
Why These Signals Matter Most Near Expiration
Gamma becomes more sensitive as expiration approaches, especially around ATM strikes. That means the same $1 move in price can force much larger hedging adjustments in 0DTE and front-week contracts than it would further out on the curve.
This is why GEX and the ZGL become most relevant during expiration week, around large open-interest concentrations, and in names with heavy speculative flow. Near OPEX, regime transitions can happen faster and with greater force because gamma itself is larger and decays more rapidly. For the full expiration-cycle timeline and how gamma acceleration changes character across the 0–14 DTE window, see Options Expiration Cycle: OPEX, Gamma Dynamics, Assignment & Pin Risk.
What Traders Should Check Every Morning
A simple pre-market checklist can turn GEX and the ZGL from abstract theory into a repeatable decision tool:
- Where is spot relative to the ZGL?
- How far is spot from the ZGL in percentage terms?
- Which strikes carry the largest positive and negative GEX?
- Which expiration is driving the current gamma profile?
- Is the market near a catalyst such as OPEX, earnings, or a heavy 0DTE session?
If you answer those questions before the open, you begin the session with a structural map instead of a reactive opinion.
Final Takeaway
Gamma Exposure explains how strongly dealer hedging can influence price. The Zero Gamma Level explains when that influence changes from stabilizing to destabilizing. Used together, they form one of the most practical frameworks for understanding options-driven market structure.
Traders who understand the regime can align strategy with structure. Traders who ignore the regime often end up using the right setup in the wrong environment. That is exactly the kind of error GEX and the ZGL are designed to reduce.
For the complete integration of GEX regime and ZGL position into a multi-signal structural scoring system, see Strike Wall Analysis: GEX, OI and Max Pain Scoring. For the mechanics of what happens when a negative-gamma regime combines with a dominant call wall breach to produce a self-reinforcing forced-buying cascade — the extreme case of the regime dynamics described here — see Gamma Squeeze Mechanics: Dealer Flow and the Forced-Buying Cascade.