What Is a Strike Wall?
A strike wall is a price level in the options market at which the convergence of structural forces — concentrated open interest, dealer gamma exposure, directional put/call imbalance, and proximity to the Max Pain payout minimum — creates a mechanical gravitational field that influences price behavior. Strike walls are not drawn by technical analysts. They emerge from the aggregate hedging obligations of market makers and the positioning of institutional participants.
The distinction matters because traditional support and resistance levels rely on price memory — levels where buyers and sellers have historically interacted. Strike walls are mechanically enforced: dealer delta-hedging creates real order flow at these levels on every price approach. A call-heavy wall creates a ceiling because dealers short the calls must sell the underlying on rallies to maintain delta neutrality. A put-heavy wall creates a floor because dealers short the puts must buy the underlying on declines. The market is not remembering a level — it is being actively pushed back from it.
Technical support and resistance is price memory — historical
reactions at a level.
A strike wall is mechanical dealer obligation — enforced in real
time by delta-hedging flows every time price approaches the level.
The two often coincide, but only the strike wall has a structural reason to hold
that is independent of price action.
The Four Structural Layers
Not all high-OI strikes are genuine walls. Not all gamma concentrations produce meaningful price resistance. The quality of a strike wall is determined by how many independent structural forces converge at a single price level. The framework uses four layers, each contributing one point to a 0–4 conviction score:
| Layer | Metric | Pass Condition | What It Represents | Deep Dive |
|---|---|---|---|---|
| 1 — OI Concentration | Open Interest at strike vs. neighboring strikes | OI ≥ 2× the average of the 4 nearest strikes | Capital committed. Where large institutional positioning has created a structural anchor. Requires the full OI lifecycle context — high OI is only meaningful if it is current, not residual from a prior cycle. | OI vs. Volume Guide |
| 2 — GEX Magnitude | Dealer Gamma Exposure at the strike | Strike ranks in the top 5 by absolute GEX contribution in the current expiration | Mechanical enforcement. High positive GEX at a strike means dealers must hedge large notional on every price increment through it — creating real order flow, not just passive price memory. | GEX & ZGL Guide |
| 3 — PCR Directional Bias | Put/Call OI Ratio at the specific strike |
PCR > 2.0 = floor (put-heavy); PCR < 0.5 = ceiling (call-heavy) |
Wall character. A floor means dealers are net short puts here and will mechanically buy dips. A ceiling means dealers are net short calls and will sell rallies. Without this layer, a high-OI strike has structural mass but no directional character. | PCR Guide |
| 4 — Max Pain Proximity | Distance from current Max Pain strike | Strike within 0.5% of the active Max Pain level | Gravitational alignment. When a high-OI, high-GEX, PCR-confirmed wall also sits at the Max Pain strike, two independent structural forces — dealer hedging mechanics and payout optimization — converge at exactly the same level. This is the highest-conviction structural setup in the framework. | Max Pain Theory Guide |
| Score | Wall Classification | Structural Interpretation | Suggested Action |
|---|---|---|---|
| 4 / 4 | Maximum Conviction Wall | All four structural forces align. Dealer hedging, OI gravity, directional character, and Max Pain payout mechanics simultaneously reinforce the level. | Primary structural target for expiration-week mean-reversion trades, premium selling centerpoints, and GEX confluence zones. Highest-reliability setup in Domeny A. |
| 3 / 4 | High-Conviction Wall | Three forces align. Missing one layer reduces certainty but the wall has clear mechanical substance. | Trade with standard sizing. Identify which layer is absent and monitor whether it joins before the expiration window closes. |
| 2 / 4 | Structural Reference | Two forces present. The level has gravitational mass but lacks full structural enforcement. Macro catalysts can override it easily. | Use as context — a secondary reference in range definition. Not a standalone trade trigger. Watch for score upgrade as expiration approaches. |
| 0–1 / 4 | Noise / Residual OI | Single-layer or no convergence. Likely residual OI from a prior cycle (dead wall) or coincidental volume with no mechanical backing. | Ignore for trading. Flag for dead-wall review (Section 4). |
From Raw OI to Active GEX: The Mechanical Bridge
Open interest is the raw material of a strike wall. But OI alone does not create price gravity. The bridge between static OI and dynamic price impact is dealer gamma exposure (GEX): the aggregate sum of gamma across all contracts at a strike, weighted by the dealer's net position (short options carry positive GEX for the dealer, meaning they must hedge). When a dealer is short a large block of calls at a given strike, their obligation to delta-hedge creates systematic order flow every time price approaches that level. For the complete derivation of how GEX is calculated and why its sign determines whether dealer hedging stabilizes or amplifies price moves, see Dealer Hedging Regimes: GEX and the Zero Gamma Level.
The critical insight is that GEX is a live number, not a structural memory. It changes with every new options print, every roll, and every expiration. High OI at a strike from three weeks ago carries no GEX today if those contracts have already been closed or expired. This is why the four-layer framework requires both Layer 1 (OI concentration — structural mass) and Layer 2 (GEX magnitude — active enforcement) to score above 1/4. A wall with high OI but negligible GEX is a historical artifact, not a mechanical force.
The GEX at any given strike also changes character as expiration approaches. Because gamma is inversely related to time remaining, the same OI concentration produces dramatically higher GEX in the 0–3 DTE window than it does at 10+ DTE. This gamma acceleration — where effective market-level gamma can amplify 5–10× in the final 72 hours — is what transforms a moderate structural reference at 7 DTE into a Maximum Conviction Wall by the day before expiration. The full temporal mechanics of this acceleration, and how it interacts with the monthly and quarterly OPEX roll-off cycles, are covered in Options Expiration Cycle: OPEX, Gamma Dynamics, Assignment & Pin Risk.
Live Walls vs. Dead Walls
The most consequential diagnostic in strike wall analysis is the live vs. dead wall distinction. A dead wall is a high-OI strike from a prior expiration cycle that has not been rolled forward. It shows up in any OI scan as an apparently significant level — but it carries no GEX, no dealer hedging obligation, and no mechanical force. Trading against a dead wall as though it were a structural support or resistance is one of the most common and costly errors in options-based analysis.
| Characteristic | Live Wall | Dead Wall |
|---|---|---|
| OI source | Current expiration cycle — contracts still open | Residual OI from expired or closed contracts not yet fully cleared |
| GEX contribution | Active and measurable — appears in real-time GEX profile | Zero or negligible — expired gamma has no hedging obligation |
| DTE context | Contracts in front or next month expiration cycle, active OI | High OI that failed to roll or represents net long OI from buyers who have since closed |
| Price reaction | Mechanical — dealer hedging creates real order flow on approach. Price can pause, reverse, or compress range near the wall. | Coincidental — if price stalls here, it is due to another factor (chart pattern, liquidity node, macro level). Not the wall itself. |
| Score eligibility | Eligible for all four layers. Layer 2 (GEX) will score ≥ 1 if the wall is live. | Fails Layer 2 automatically. Maximum score is 1/4 (OI alone). Classified as noise in the framework. |
| Diagnostic | Cross-reference OI scan with GEX profile. Live OI will appear in both. Verify the expiration date of the high-OI contracts. | High OI with zero GEX profile contribution. Or high OI in an expiration that has already passed with no fresh rollover. |
After a major monthly OPEX, a significant portion of total OI simply expires. The subsequent days can show high residual OI in near-dated expirations that is either being rolled or awaiting settlement confirmation. Never use a static OI screenshot taken during OPEX week as your structural reference for the following week. Rebuild your wall map entirely from the fresh expiration cycle that opens after settlement. The full OI roll-off dynamics are covered in Options Expiration Cycle: OPEX, Gamma Dynamics, Assignment & Pin Risk.
The Strike Wall Scoring Framework: Applied
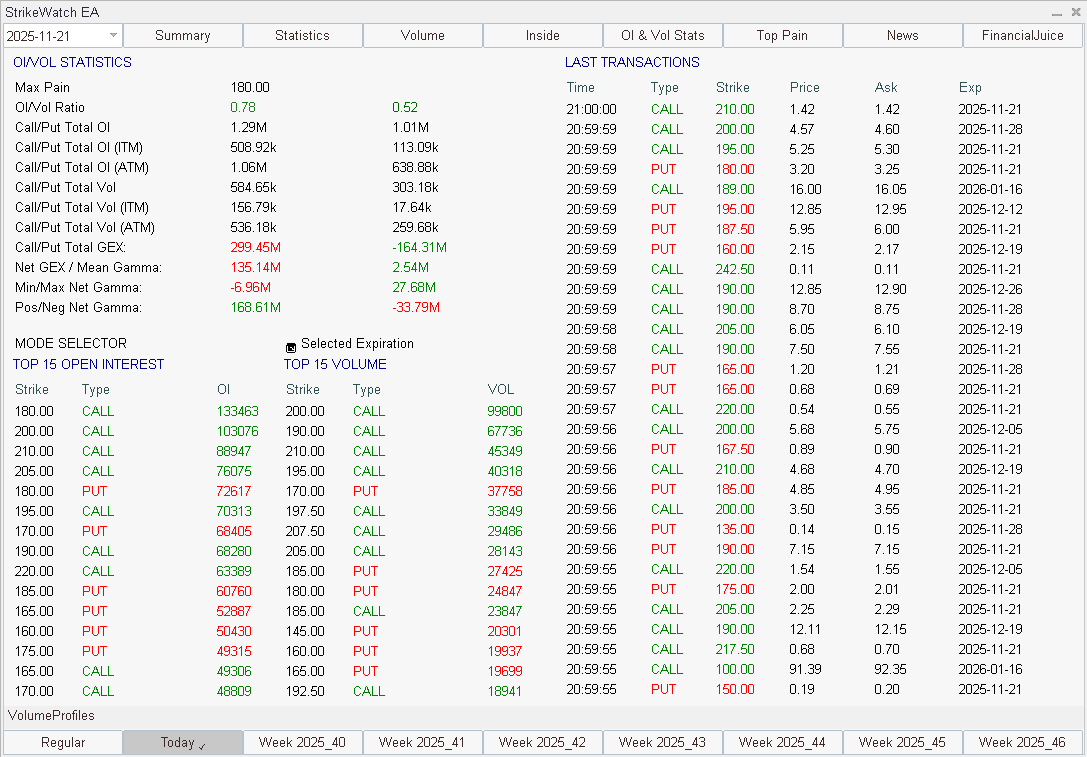
Applying the four-layer score in practice requires three inputs available in any institutional options platform: the OI chain for the target expiration, the GEX profile by strike, and the current Max Pain calculation. StrikeWatch EA integrates all three into one panel. For manual application:
- Pull the OI chain for the front expiration. Identify the top 10 strikes by open interest. Calculate the average OI of the four nearest strikes around each candidate. If a strike's OI is ≥ 2× this local average, it passes Layer 1. For the complete four-scenario OI/Volume diagnostic matrix (distinguishing new positioning from liquidation), see Open Interest vs. Volume Explained.
- Cross-reference the GEX profile. Map the GEX contribution by strike from the dealer gamma model. If the candidate strike ranks in the top 5 by absolute GEX, it passes Layer 2 and is confirmed as a live wall. Any candidate that passes Layer 1 but not Layer 2 is a dead wall — remove it from the active wall map. The complete GEX mechanics and ZGL regime context are in Dealer Hedging Regimes: GEX and the Zero Gamma Level.
- Check the per-strike PCR. For each surviving candidate, calculate the PCR: put OI divided by call OI at that specific strike. PCR > 2.0 = floor character (Layer 3 pass, put-heavy). PCR < 0.5 = ceiling character (Layer 3 pass, call-heavy). PCR between 0.5 and 2.0 = mixed character (Layer 3 fail — the wall lacks directional definition). Note: the per-strike PCR is distinct from the aggregate market-wide Put/Call Ratio used as a contrarian sentiment indicator. For the aggregate PCR methodology, term-structure effects, and its use as a macro positioning signal, see Put/Call Ratio: Sentiment, Positioning & Structure Guide.
- Check Max Pain proximity. Obtain the current Max Pain strike for the target expiration (real-time, not a stale snapshot). If the candidate wall is within 0.5% of the Max Pain level, it passes Layer 4. This is the convergence of payout optimization mechanics with structural OI gravity — and it is most powerful in the 0–2 DTE window when pin risk is highest. A wall that scores 2/4 or 3/4 earlier in the week can upgrade to 4/4 as expiration approaches and the Max Pain layer activates. For the full DTE validity window and Local Pain refinements (filtering deep OTM distortions from the global calculation), see Max Pain Theory: How Market Makers Pin Options Strikes at Expiration.
The resulting 0–4 score is a structural conviction index, not a trade signal by itself. The score tells you how much mechanical force is present at a level. Whether to trade against it, through it, or toward it depends on the GEX regime (are we above or below the Zero Gamma Level?), the DTE window (is the wall active or inert?), and the macro calendar (is a catalyst present that overrides structural mechanics?).
Call Walls vs. Put Walls: Mechanical Character
The Layer 3 PCR score determines not just whether a wall exists but how it behaves. Call walls and put walls operate through opposite dealer hedging mechanics and require different trading approaches.
| Feature | Call Wall (PCR < 0.5 — Call-Heavy) | Put Wall (PCR > 2.0 — Put-Heavy) |
|---|---|---|
| Structural role | Ceiling — mechanical resistance above current price | Floor — mechanical support below current price |
| Dealer position | Net short calls at this strike | Net short puts at this strike |
| Dealer hedging action | Must sell underlying as price rises toward this strike (delta of short call increases — sell to maintain neutrality) | Must buy underlying as price falls toward this strike (delta of short put increases — buy to maintain neutrality) |
| Effect on price | Systematic selling pressure on rallies. Price compresses below the ceiling in positive-GEX regimes. In negative-GEX, breaching the call wall reverses the hedging direction and can trigger a short-gamma squeeze upward. | Systematic buying pressure on dips. Price bounces from the floor in positive-GEX regimes. In negative-GEX, breaking through the put wall removes the mechanical buyer and accelerates the decline. |
| Trading use | Short call spreads, covered calls, bear call spreads with short strike at or below the call wall. Mean-reversion sells on rallies into the wall in positive-GEX. | Short put spreads, cash-secured puts, bull put spreads with short strike at or above the put wall. Mean-reversion buys on dips into the wall in positive-GEX. |
| Failure mode | Strong negative-GEX breakout above the call wall triggers a gamma squeeze — dealer short-call hedging reverses and becomes forced buying. The wall fails and accelerates the move. | Strong negative-GEX breakdown through the put wall removes the mechanical floor. Dealers who are short puts now face accelerating delta loss and may reduce hedging — the floor becomes a cliff. |
Call wall and put wall mechanics are regime-dependent. In a positive-GEX regime (spot above the Zero Gamma Level), walls hold reliably — dealer hedging reinforces them. In a negative-GEX regime, the same walls can amplify breakouts: once breached, the hedging mechanics reverse direction and push price further through the wall rather than back toward it. Always check the GEX regime before assuming a wall will hold.
Temporal Dynamics: How Walls Build and Dissolve
Strike walls are not static features of the options landscape — they evolve through a predictable lifecycle governed by the OPEX gamma cycle. Understanding when a wall is in its peak structural phase versus when it is building or dissolving is as important as understanding its score at any given moment.
| Phase | Timing | Wall Characteristics | Score Reliability | Trading Implication |
|---|---|---|---|---|
| Building | 14–30 DTE | OI accumulating gradually. GEX growing but not yet dominant. PCR character establishing. Max Pain still shifting. | Layers 1–3 may score 2/4–3/4. Layer 4 (Max Pain) unreliable at this DTE. | Monitor walls as structural context for weekly trades. Do not use as primary expiration targets. |
| Maturing | 7–13 DTE | OI stable or growing. GEX gaining significance. PCR fully defined at major strikes. Max Pain stabilizing. | Consistent 2/4–3/4 scores possible on dominant strikes. Layer 4 beginning to activate. | Identify the expiration week anchor strikes. Begin structuring premium-selling positions around confirmed walls. |
| Peak | 0–3 DTE (OPEX window) | Gamma acceleration 5–10× its earlier level. Walls at high-OI strikes produce intense mechanical compression. Max Pain gravity at maximum. Pin risk active. | 4/4 walls possible and highly reliable. Maximum pin conviction for high-OI underlyings in low-catalyst environments. | Primary mean-reversion targets. Max Pain + GEX confluence = double-gravity zone. Highest-conviction structural setups. |
| Dissolving | Post-OPEX (0–5 days after) | 20–50% of total OI rolls off or expires. GEX collapses. Max Pain resets for the next cycle. Old walls become dead walls. | All scores reset to 0. Prior walls provide no structural enforcement until new OI accumulates in the fresh cycle. | Post-OPEX window of weakness. Market loses structural guardrails. Trend and macro forces dominate. Rebuild wall map from scratch. |
| Rebuilding | 5–14 DTE after OPEX | New cycle OI begins accumulating. Fresh GEX profile emerging. PCR character at new strikes forming. Previous expiration's structural levels fully invalidated. | Early 1/4–2/4 possible. No Layer 4 activation yet. | Observe and map. Identify the emerging dominant strikes for the next expiration. Prepare the scoring framework. |
The full mechanics of this lifecycle — including the post-OPEX gamma cliff, how call-weighted vs. put-weighted expirations produce different dissolution dynamics, and the structural implications of quarterly vs. monthly OPEX events — are covered in detail in Options Expiration Cycle: OPEX, Gamma Dynamics, Assignment & Pin Risk. That article is the foundational reading for anyone using the temporal phase framework described above.
Practical Pre-Market Workflow
The following seven-step workflow converts raw options data into a scored structural map in under five minutes with StrikeWatch EA open:
- Identify the temporal phase. What DTE are we in relative to the nearest expiration? Check the OPEX calendar. If post-OPEX dissolution window (0–5 days after expiration), defer the wall-scoring process — there are no live walls yet. If 14+ DTE, walls are in building phase — use as context only. If 0–3 DTE, walls are at peak reliability — apply full scoring with maximum conviction.
- Check the GEX regime first. Is spot above or below the Zero Gamma Level? Positive-GEX regimes produce wall reinforcement — mean-reversion trades have structural backing. Negative-GEX regimes produce wall failures and breakouts — adapt trading approach accordingly.
- Pull the Top 15 OI strikes and apply the four-layer score. For each candidate: Layer 1 (OI ≥ 2× local average), Layer 2 (top 5 GEX contribution), Layer 3 (PCR > 2.0 or < 0.5), Layer 4 (within 0.5% of Max Pain). Record the 0–4 score for each.
- Verify Max Pain (real-time, not stale). Confirm the current Max Pain level from a live calculation — not from an external source that may reflect OI snapshots from earlier in the week. Max Pain shifts as positions are opened, rolled, and closed. A Wednesday snapshot may be materially wrong by Friday close. The full Local Pain refinement methodology is in Max Pain Theory.
- Classify each surviving wall as floor or ceiling. Using the PCR from Layer 3, assign directional character to each 2/4–4/4 wall. Map them above and below current spot. This produces your structural range: the nearest ceiling above spot and the nearest floor below it define the mechanical boundaries of the current session.
- Check the macro calendar. Is there an FOMC, CPI, earnings, or other scheduled catalyst within the expiration window? If yes, wall mechanics are overridden by IV expansion until the event resolves. Apply Max Pain and wall scores only in the post-event IV-crush environment if within the active DTE window.
- Assign conviction levels to potential trades. Any trade that targets a 3/4 or 4/4 wall in a positive-GEX regime, within the 0–3 DTE window, with no macro catalyst present, is a maximum-conviction structural setup. Size accordingly. Trades targeting 2/4 walls or operating in negative-GEX require tighter risk management and smaller initial size.
Common Errors in Strike Wall Analysis
- Using dead walls as active support/resistance. The most common and costly error. Any high-OI strike that fails Layer 2 (no GEX contribution) is a dead wall. Treating residual OI from a prior cycle as a structural level produces false signals with zero mechanical backing.
- Applying wall analysis outside the valid DTE window. Strike walls are gravitationally dominant only in the 0–3 DTE window. At 10+ DTE, the same OI creates modest GEX and minimal pin risk. Treating early-week walls as expiration-Friday pin targets consistently overstates their reliability.
- Ignoring the GEX regime. In negative-GEX environments, walls fail and amplify. A 4/4 call wall in a negative-GEX regime is not a sell signal — it is a potential breakout accelerator if breached. The regime always takes priority over the wall score.
- Using a single layer as the complete signal. High OI alone is noise without GEX confirmation. A put-heavy PCR alone is context without OI mass. The scoring framework exists precisely because each layer in isolation produces too many false signals. Only convergence creates reliable walls.
- Using stale Max Pain data. A static Max Pain screenshot from Monday is often meaningless by Thursday as OI shifts. Always use a real-time calculation. The Layer 4 score is invalid if the Max Pain reference is more than a few hours old during OPEX week.
- Confusing the per-strike PCR with the aggregate Put/Call Ratio. The market-wide PCR is a contrarian sentiment signal. The per-strike PCR is a directional wall-character signal. They answer different questions and should never be substituted for each other. For the aggregate PCR methodology, see Put/Call Ratio: Sentiment, Positioning & Structure Guide.
- Applying wall analysis during earnings or FOMC weeks without adjustment. IV expansion during a catalyst event overrides mechanical pin risk entirely. Post-event IV crush may reassert the pin — but the event move itself is structurally unconstrained. Never apply a Max Pain or GEX wall as a target for an intraday catalyst move.
Strike Wall Analysis in StrikeWatch EA
StrikeWatch EA implements the full four-layer scoring framework natively inside MetaTrader 5:
- OI/Volume Statistics — Top 15 Strikes panel — Displays OI concentration, GEX contribution rank, per-strike PCR, and Max Pain proximity for the top 15 strikes simultaneously. The four-layer score is calculated automatically. Walls at 3/4 and 4/4 are flagged as structural priority levels.
- GEX Profile — Live/Dead Wall filter — The GEX profile by strike visually separates live walls (with active GEX contribution) from dead walls (OI without corresponding GEX). Any strike absent from the GEX profile is automatically classified as a dead wall, regardless of its raw OI level.
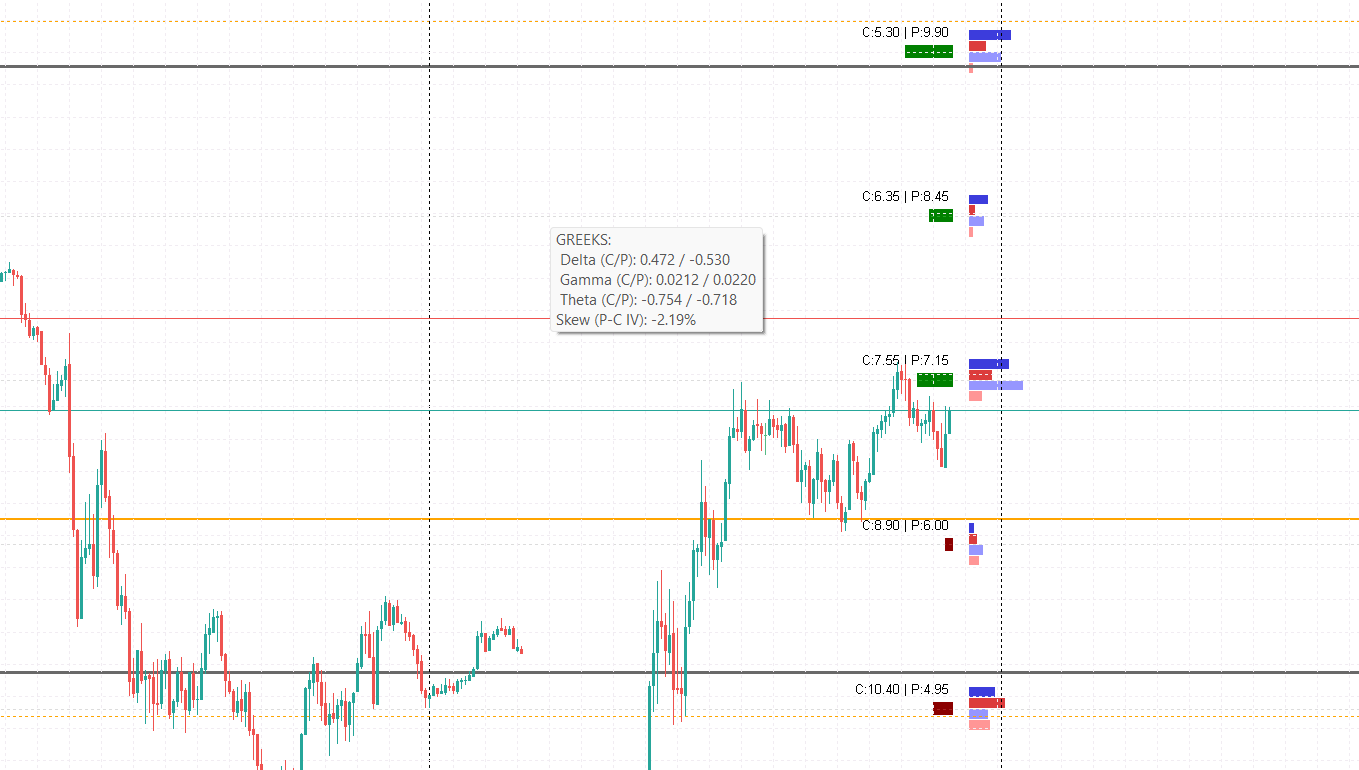
- On-Chart HUD — Structural overlay — All 3/4 and 4/4 walls are plotted as dynamic horizontal lines on the MT5 price chart, alongside the Zero Gamma Level and Max Pain level. Call walls are styled as ceilings; put walls as floors. The complete structural map is visible without leaving the trading terminal.
- Real-time Max Pain recalculation — The Max Pain level updates continuously as new options data arrives. Layer 4 activation is automatic — when any live wall moves within 0.5% of the current Max Pain, the score is immediately upgraded without manual intervention.
- OPEX cycle status indicator — The interface displays the current DTE to the nearest expiration and the temporal phase (Building / Maturing / Peak / Dissolving), providing instant context for whether the wall scores in the current session are structurally active or in their early accumulation phase.
- Multi-expiration wall comparison — The Term Structure surface shows dominant walls across up to 10 expirations simultaneously — enabling identification of structural levels that are reinforced across multiple cycles, which carry the highest conviction as medium-term anchors.
Strike walls are mechanically enforced by dealer delta-hedging
— not price memory. Only strikes with active GEX (live walls) carry structural
force.
The four-layer score (0–4) combines OI concentration,
GEX magnitude, PCR directional character, and Max Pain proximity. 4/4 is a
Maximum Conviction Wall — the highest-reliability structural setup in Domeny A.
The temporal phase governs reliability. Walls peak in the
0–3 DTE window. Outside this window, treat wall scores as structural
context, not trade triggers. The OPEX gamma cycle determines which phase you
are in — full framework in
Options
Expiration Cycle.
Regime always takes priority. In positive-GEX regimes, walls
hold. In negative-GEX regimes, walls can fail and accelerate breakouts. Check
the
Zero Gamma Level before
applying any wall score.
Per-strike PCR ≠ aggregate PCR. The per-strike ratio reveals
wall character (floor vs. ceiling). The aggregate ratio reveals market sentiment.
Both are valuable, but for different purposes — full aggregate methodology in
Put/Call Ratio:
Sentiment, Positioning & Structure Guide.
Max Pain is time-gated. Layer 4 of the wall score only activates
reliably in the 0–2 DTE window. Earlier in the expiration cycle, use the
first three layers as your primary structural filter. Full DTE validity framework
in
Max
Pain Theory.
Rebuild the wall map after every OPEX. Post-expiration
dissolution wipes 20–50% of total OI. Prior walls become dead walls
instantly. The new cycle begins from near-zero structural mass.