What Is a Gamma Squeeze?
A gamma squeeze is a mechanical price acceleration event triggered by the forced delta-hedging obligations of market makers who are net short options gamma. It is not a random breakout, a momentum anomaly, or a form of coordinated manipulation. It is the mathematical consequence of dealer gamma positions scaling non-linearly as price moves through concentrated open-interest strikes — in a regime where that hedging amplifies rather than absorbs directional movement.
The core mechanism is straightforward. When dealers are net short calls at a given strike, they must continuously buy the underlying to maintain delta neutrality as price rises. If price approaches a large call-heavy strike from below, dealer call deltas increase sharply — forcing them to buy more stock per each additional price increment. That buying pressure pushes price higher. Higher price forces higher call deltas. Higher deltas force more buying. The feedback loop is self-reinforcing until gamma exhausts — either because the strike is now deep in-the-money and delta has stabilized, or because the options expire and the hedging obligation disappears.
A short squeeze forces short sellers to buy back borrowed shares
they have sold — it requires short interest to exist as fuel.
A gamma squeeze forces market makers to buy the underlying to
delta-hedge their short call book — it requires only concentrated call OI
and a regime where dealer hedging amplifies rather than absorbs the move.
The two can compound. But gamma squeezes can occur with near-zero short interest.
Short squeezes require short interest as a precondition. Knowing which mechanism
is active determines the setup, the duration, and the exit.
Gamma squeezes are not exclusively upside phenomena. A downside gamma squeeze — or negative gamma cascade — occurs symmetrically when dealers net short puts are forced to sell the underlying as price declines through their short put strikes. Every put delta increase forces more selling, which drives price lower, which forces more put delta increase. This is the structural mechanism behind air-pocket selloffs in negative gamma regimes: what appears to be free-fall is often dealer hedging amplifying a move that would otherwise be modest.
The Mechanical Foundation: Dealer Short Gamma and the Hedging Cascade
The complete derivation of dealer delta-hedging mathematics — why dealers must continuously rebalance their positions, how GEX quantifies the dollar-denominated forced flow per price increment, and how the Zero Gamma Level marks the boundary between stabilizing and amplifying regimes — is covered in full in Dealer Hedging Regimes: GEX and the Zero Gamma Level. For the purposes of this guide, the squeeze-specific consequence is this: when dealers are net short calls, their delta-hedging obligation scales non-linearly as price approaches the short strike — and that scaling accelerates toward infinity as DTE approaches zero. The result is a self-reinforcing cascade that terminates only when gamma exhausts (the short call moves deep ITM and delta stabilizes near 1.0), when the options expire (hedging obligation disappears entirely), or when the counterparty closes or rolls the position (dealer delta resets). Everything else in this guide builds on that single mechanical fact.

Two Types: Upside and Downside Gamma Squeeze
Gamma squeezes occur in both directions. The mechanics are mirror images, but the behavioral characteristics are asymmetric — upside squeezes tend to be more explosive and shorter in duration, while downside squeezes tend to be more sustained and structurally dangerous.
| Feature | Upside Gamma Squeeze | Downside Gamma Squeeze (Negative Cascade) |
|---|---|---|
| Trigger | Price breaks above a dominant call wall in a negative-GEX regime. Dealers short calls must buy underlying to hedge expanding deltas. | Price breaks below a dominant put wall in a negative-GEX regime. Dealers short puts must sell underlying to hedge expanding deltas. |
| PCR signal | Per-strike PCR < 0.5 at the breached call wall — call-heavy, dealers are net short calls | Per-strike PCR > 2.0 at the broken put wall — put-heavy, dealers are net short puts |
| GEX character | Negative net GEX (aggregate). Large negative GEX bar at the call wall strike on the histogram. | Negative net GEX (aggregate). Large negative GEX bar at the put wall strike — but structurally from the put side. |
| Speed and character | Fast, often violent. Equity markets have a structural long bias — call walls are tested more aggressively and break faster. Short-lived but explosive, often exhausting in 1–3 sessions. | Slower buildup, but can become self-sustaining over multiple sessions as put gamma accumulates at successively lower strikes. The cascade is harder to stop once structural floors are broken. |
| Short squeeze compound risk | High. Forced dealer buying can trigger stop-losses on short equity positions, adding a second wave of forced buying on top of gamma flow. | Moderate. Margin calls on leveraged longs are triggered by forced dealer selling, adding liquidation selling to the cascade. |
| Post-squeeze behavior | Sharp mean-reversion risk once gamma exhausts. The mechanical buying stops abruptly, removing the floor that was supporting the move. Price can retrace 40–60% of the squeeze range quickly. | Post-cascade stabilization can be sudden — especially when the expiring put OI rolls off and dealer selling obligations disappear. The recovery can be sharp precisely because it removes the mechanical seller. |
| Primary use case | Long calls, long underlying, or debit call spreads. Enter on confirmed ZGL breach and call wall break, not before. | Long puts, short underlying (small size), or long put spreads. The downside cascade is harder to time — put walls break less cleanly than call walls in bull-biased markets. |
Put walls are generally harder than call walls — institutional
fear-hedging creates more concentrated, defensive OI at downside strikes.
This means upside gamma squeezes tend to be more violent on a per-DTE basis
because call walls, once breached, offer less structural resistance to the
forced-buying cascade.
Downside squeezes develop more slowly against structurally harder floors —
but when those floors finally break, the subsequent cascade can be more
sustained because each lower put wall represents another forced-selling trigger.
The Squeeze Lifecycle: Six Phases
A gamma squeeze does not begin with a breakout — it begins with a structural setup that can be identified days in advance. Each phase has distinct characteristics, measurable signals, and different implications for positioning.
| Phase | Timing | Structural Characteristics | Observable Signals | Positioning Implication |
|---|---|---|---|---|
| 1 — Buildup | 7–14 DTE | Call OI accumulates at strikes above spot. Speculative call buying + covered call writing concentrates gamma. Net GEX gradually turns more negative. ZGL still safely above spot. | OI increasing at 1–3 dominant call strikes. Per-strike PCR falling below 1.0 at those strikes. Net GEX trending toward zero from positive territory. | Map the forming call walls. Not yet a trade — observe. Score the dominant call walls in the Strike Wall framework. Walls scoring 2/4–3/4 at this phase are candidates for squeeze setups later. |
| 2 — Compression | 3–7 DTE | Positive GEX above the ZGL is still actively pinning price in a range. Walls are fully formed and scored 3–4/4. Realized volatility compressed. Price oscillating below the dominant call wall. Dealer selling into rallies is mechanically absorbing upside attempts. | Narrowing daily ranges. Intraday rallies stall at the same level repeatedly. Volume below average on rally attempts. Max Pain aligned with or below current spot. Call wall PCR still < 0.5. | This is the pin-risk window — mean-reversion premium sellers are operating with structural support. Do NOT position for the squeeze yet. The compression phase produces false breakout signals that resolve back into the range. |
| 3 — Trigger | 0–3 DTE | A catalyst — volume spike, macro news, overnight gap, or institutional market-on-open order — pushes price above the call wall on elevated volume. GEX turns decisively negative. ZGL is breached. | Volume 1.5–2× average on the breakout candle. Call wall OI strike prints on high volume (aggressor-side: buying at ask). Net GEX crosses into negative territory. Spot closes above ZGL intraday. | The squeeze entry window opens at the confirmed ZGL breach on volume — not on the first touch. Enter long calls, long underlying, or a debit call spread. Stop below the breached call wall (now support). Size small — the cascade has not yet started. |
| 4 — Cascade | Hours to 1–2 sessions post-trigger | Dealer forced-buying flow overwhelms any natural sellers. Price accelerates beyond the initial breakout without the usual retracement. Volume expands. Spread widens on options as market makers struggle to re-price rapidly changing deltas. | Price moves exceed 1 standard deviation of the IV-implied expected move in the remaining DTE window. Implied volatility rising (dealers repricing calls higher as demand spikes). The Real-Time Options Tape shows large aggressive call buying. | Remain in the position. Add only on confirmed continuation candles, not on extension spikes. The cascade phase is where the largest gains occur — but also where the most common mistake is made: adding at the top of the cascade just before exhaustion. |
| 5 — Exhaustion | 1 session to post-OPEX | Gamma exhausts as the dominant call strike moves deep ITM. Delta stabilizes near 1.0. Dealer forced-buying flow dramatically reduces. The mechanical accelerant disappears. Options expire, removing obligations entirely. | Volume decelerating sharply. Price moving in smaller increments despite continued directional bias. Spreads normalizing as dealers reprice. GEX profile shifting — large negative GEX bar at the trigger strike disappears (now deep ITM or expired). | Begin reducing. The mechanical buyer is leaving. Remaining price action is driven by directional sentiment and momentum, not forced dealer flow — a structurally weaker underpinning. Scale out 50–75% of the position. |
| 6 — Reset | Post-OPEX / 1–3 days after exhaustion | The structural map resets. Former call wall (now deep ITM or expired) becomes support, not resistance. New cycle OI accumulates from near-zero. If the squeeze was OPEX-driven, the gamma cliff produces the post-OPEX window of weakness. | 40–60% retracement of the squeeze range is common as the mechanical buying floor disappears. New OI maps have not yet formed. Market is in the post-OPEX dissolution window — structurally directionless. | Close remaining position. Do not carry the squeeze trade through the reset phase expecting continuation — the squeeze is mechanically over. Rebuild the structural map from scratch using the new expiration cycle's OI profile. |
Pre-Squeeze Diagnostic: The Four-Signal Framework
The highest-value application of squeeze mechanics is identifying the setup before the trigger — not reacting to the cascade after it has already moved 5%. The following four-signal framework uses the same data layers as the Strike Wall scoring system, reconfigured specifically to detect pre-squeeze conditions.
Signal 1 — Deeply Negative Net GEX
The necessary precondition for any gamma squeeze is that dealers are net short gamma at the aggregate level. When net GEX is deeply negative, dealer hedging is already in amplification mode — any directional move is being accelerated, not absorbed. The more negative the net GEX, the less price action is needed to trigger a squeeze.
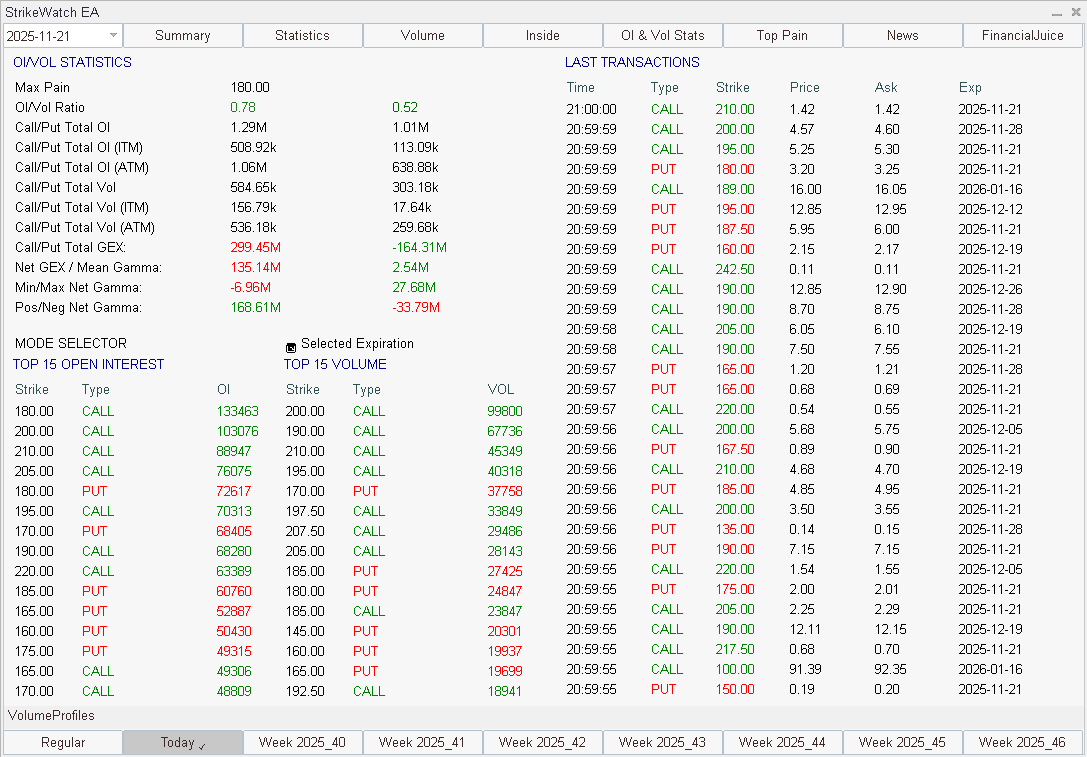
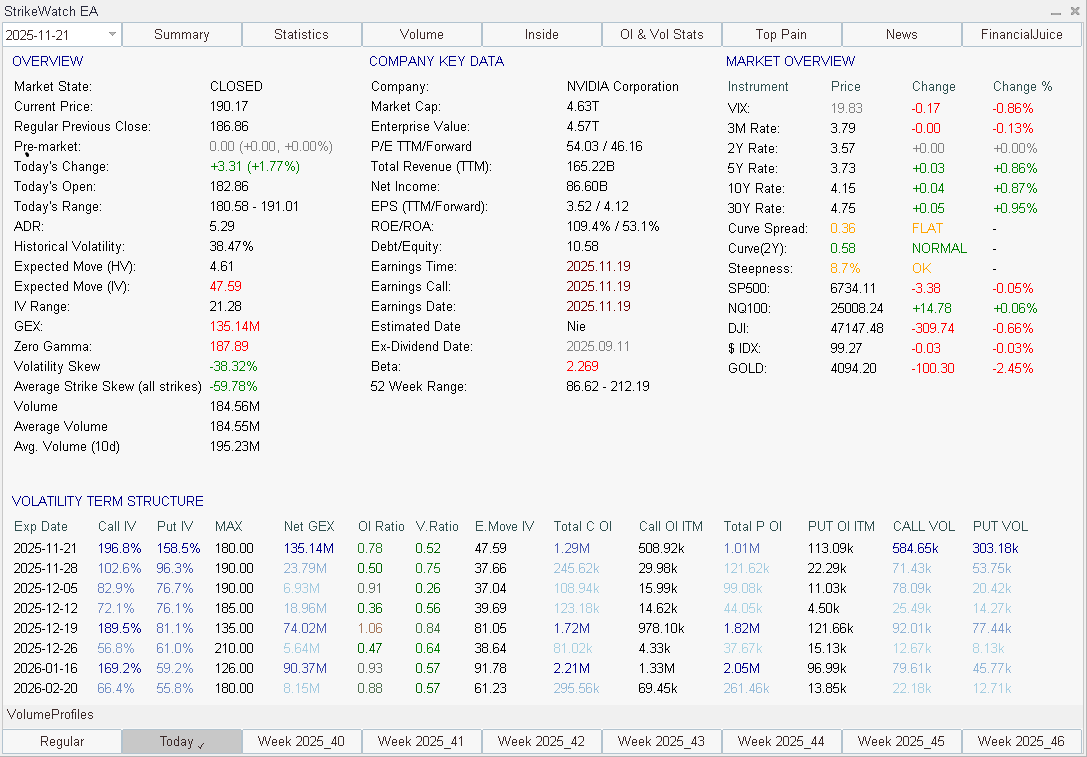
Quantitatively: net GEX below −$50M for SPY or a comparable large-cap is a high-sensitivity environment. For single stocks, the threshold is relative — look for the net GEX to be the most negative reading in the trailing 10–14 sessions. StrikeWatch EA displays real-time net GEX in the Summary Surface module alongside the GEX profile by strike. For the complete mechanics of how net GEX sign and magnitude determine the dealer hedging regime, see Dealer Hedging Regimes: GEX and the Zero Gamma Level.
Signal 2 — Call OI Concentration Immediately Above Spot
Gamma squeeze fuel requires concentrated call open interest sitting just above current price — close enough that a modest move in spot would bring the dominant call strike into high-gamma territory. A call wall 10% above current price is not a squeeze setup. A call wall 1.5–3% above current price in the 0–5 DTE window is a loaded spring.
The target configuration: a call strike ranking in the top 3 by OI for the nearest expiration, sitting within 2–3% of spot, with that OI concentrated in contracts expiring within 7 DTE. This ensures that gamma at the strike is large enough to produce meaningful forced flow on a breakout. For the full OI concentration diagnostic — including how to distinguish live call walls from residual dead-wall OI that carries no gamma — see Open Interest vs. Volume Explained.
Signal 3 — Per-Strike PCR Below 0.5 at the Dominant Call Wall
Net GEX tells you the aggregate regime. Call OI concentration identifies the location. But neither confirms that dealers specifically are net short the calls concentrated there. That confirmation comes from the per-strike Put/Call Ratio at the dominant call wall.
A per-strike PCR below 0.5 at the target call strike confirms that call OI dramatically exceeds put OI at that level. Since dealers typically take the other side of retail and institutional option flow, heavy call-buying activity at a strike translates to dealer short-call positioning — the exact configuration that creates forced-buying flow on a breakout. A PCR between 0.5 and 1.0 at the target call wall is inconclusive; above 1.0 suggests the call OI is balanced or put-dominated, which means the squeeze fuel is not properly loaded.
Note: the per-strike PCR is distinct from the aggregate market Put/Call Ratio, which measures overall sentiment. For the complete methodology distinguishing these two uses of the ratio, see Put/Call Ratio: Sentiment, Positioning & Structure Guide.
Signal 4 — ZGL Within 1–2% Above Current Spot
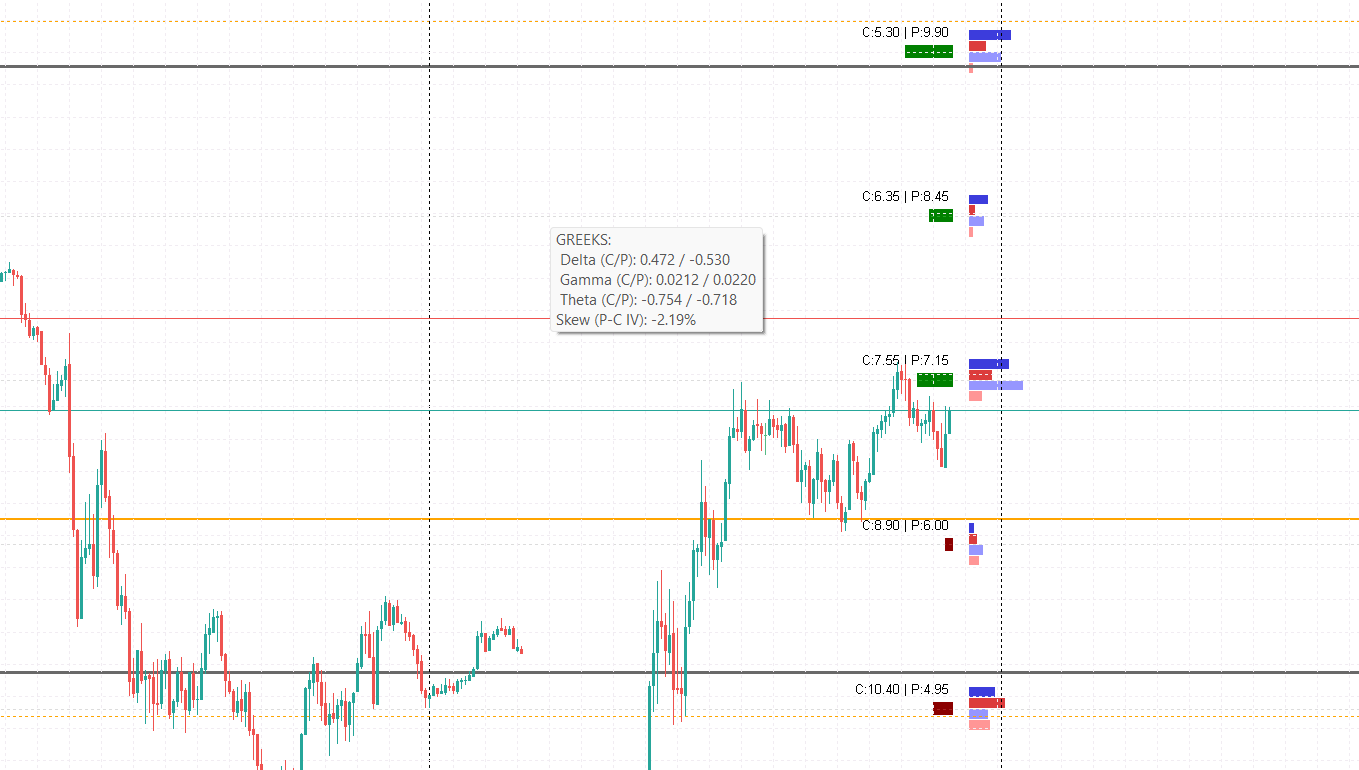
The Zero Gamma Level is the price threshold where aggregate dealer gamma crosses from positive (stabilizing) to negative (amplifying). When spot is within 1–2% below the ZGL, the regime flip is imminent. A single catalyst — a positive macro print, an overnight gap, or a large institutional market order — can push spot above the ZGL, instantly converting dealer hedging from a damping force to a self-reinforcing buying machine.
This is the most time-sensitive of the four signals. The ZGL moves as open interest changes, contracts decay, and positions are rolled. A ZGL that is 4% above current spot is not a squeeze setup precondition — it is too distant for a single catalyst to bridge. Monitor the ZGL distance daily during the 7–14 DTE window. When it contracts to within 1–2%, the setup is maturing. When spot breaches it, the trigger is live.
The Squeeze Conviction Matrix
| Signals Active | Setup Classification | Structural Interpretation | Action |
|---|---|---|---|
| 4 / 4 | Maximum Conviction Squeeze Setup | All four structural preconditions align. Deeply negative GEX, loaded call wall 1–3% above spot, per-strike PCR confirmed dealer short calls, ZGL within 1–2%. Any catalyst can trigger. | Establish a small starter long position or long call before the trigger. Prepare the full entry plan for the ZGL breach confirmation. Highest-conviction pre-squeeze trade in the framework. |
| 3 / 4 | High-Probability Setup | Three signals confirmed. One layer missing — identify which and monitor. Missing ZGL proximity is the most critical gap (the regime flip may not occur this cycle). Missing PCR confirmation means dealer positioning is ambiguous. | Watch but do not pre-position. Enter only on confirmed ZGL breach with volume. Missing one signal significantly increases the probability of a false trigger. |
| 2 / 4 | Structural Context Only | Two signals present. The conditions for a squeeze are partially forming but are not yet aligned. GEX + call OI without ZGL proximity and PCR confirmation is the most common 2/4 state — negative regime with ammunition but no ignition proximity. | Monitor daily. Do not trade the squeeze setup until at least 3/4 signals confirm. File as a candidate for the next 5–7 DTE window if the cycle is maturing correctly. |
| 0–1 / 4 | No Setup | Insufficient structural preconditions. Any call breakout at this point is directional momentum, not a gamma squeeze. Dealer hedging is not positioned to produce forced-flow amplification. | Ignore as a squeeze setup. Apply standard Strike Wall framework for the session. |
Gamma Squeeze vs. Short Squeeze: Critical Differences
The two mechanisms are frequently conflated in financial media because their price-action signatures overlap: a rapid, volume-driven rally that seems to defy fundamental logic. But the underlying mechanics, detection methods, durations, and exhaustion signals are entirely distinct.
| Dimension | Gamma Squeeze | Short Squeeze |
|---|---|---|
| Who is forced to buy | Market makers, delta-hedging their short call book | Short sellers, covering borrowed shares to limit losses |
| Precondition | Concentrated call OI in negative-GEX regime with ZGL within range. Short interest in the equity is irrelevant. | High short interest (typically >15–20% of float) or high Days-to-Cover (>5–7 days). Options OI is irrelevant. |
| Detection tool | GEX Profile (negative), ZGL proximity, per-strike PCR < 0.5 at dominant call wall | Short Interest > 15% of float, Days-to-Cover > 5, short interest trend increasing |
| Trigger | Price breaches the call wall above the ZGL on volume — dealer hedging mechanics automatically activate | A positive catalyst (earnings beat, news, technical breakout) causes short sellers to begin covering — a sentiment and margin-driven decision |
| Duration | Hours to 1–3 sessions. Ends mechanically when gamma exhausts (deep ITM) or options expire. Very predictable termination condition. | Days to weeks. Ends when short interest drops to normal levels. Termination is sentiment-driven and less predictable. |
| Post-squeeze behavior | Abrupt. The mechanical floor disappears when gamma exhausts. 40–60% retracement common within 1–2 sessions. | Gradual. Short interest normalizes over days. More sustained plateau before mean-reversion, if it occurs at all. |
| Can they compound? | Yes — and when they do, the result is the most violent price action in modern markets. The 2021 GME event combined both: heavy call buying created negative GEX and a gamma squeeze, while simultaneously forcing short sellers with 140% float short to cover. Two independent forced-buying mechanisms operating simultaneously produced a 10× move in days. When both signals are present simultaneously, the setup is maximum conviction. | |
The OPEX Amplifier: Why Expirations Supercharge Squeezes
The four-signal framework identifies squeeze setups. But the timing within the expiration cycle determines whether those setups produce modest accelerations or violent, historically significant moves. The OPEX cycle is the primary amplifier.
Gamma Acceleration Near Expiration
Mathematically, gamma for an at-the-money option is approximately proportional to \( \frac{1}{S \cdot \sigma \cdot \sqrt{\tau}} \), where \(\tau\) is time remaining in years. As \(\tau \to 0\), gamma explodes for ATM strikes. Moving from 7 DTE to 1 DTE increases ATM gamma by approximately \(\sqrt{7} \approx 2.65\times\). Combined with IV compression and strike concentration, effective market-level gamma can amplify 5–10× in the final 72 hours before expiration. This is why the same call wall that produced a moderate 1–2% compression effect at 7 DTE can produce a 5–8% forced-flow cascade at 1 DTE.
Monthly and Quarterly OPEX as Peak Squeeze Windows
The most powerful gamma squeezes historically occur at monthly or quarterly OPEX events, when total OI — and thus total dealer gamma exposure — is at maximum. For context on how the OI accumulation cycle creates this peak structural loading, and why quarterly Witching events produce the most extreme gamma concentrations, see Options Expiration Cycle: OPEX, Gamma Dynamics, Assignment & Pin Risk.
| Expiration Type | Typical Peak OI | Gamma Amplification Potential | Squeeze Risk Level |
|---|---|---|---|
| 0DTE Weekly | Low–Medium per expiry | Maximum within single session (gamma fully loaded intraday) | High intraday. Short-lived — session closes and gamma resets. Most common source of intraday gamma squeezes. |
| Standard Weekly | Moderate | Moderate — 2–3× at 1 DTE vs. 5 DTE | Medium. Squeeze risk peaks Thursday–Friday of expiration week. |
| Monthly OPEX (3rd Friday) | Highest of the cycle | Very high. Maximum institutional OI across all strikes concentrates forced flow. Largest negative-GEX readings of the cycle. | Highest of regular cycle. OPEX Friday afternoon is historically the highest gamma squeeze risk window per month. |
| Quarterly Witching | Extreme (40–50% of annual cycle) | Extreme. Index futures + ETF options + equity options expire simultaneously. Institutional rolling creates massive transient gamma concentrations. | Maximum of the year. Triple/Quadruple Witching dates in March, June, September, December carry the highest structural gamma squeeze risk. Pre-OPEX pinning can transition directly into a violent post-pin squeeze. |
The Post-OPEX Gamma Cliff as Termination Signal
The natural termination mechanism for OPEX-driven squeezes is the gamma cliff — the sharp collapse in dealer gamma exposure as expiring OI rolls off after settlement. In a call-weighted OPEX squeeze, the post-expiry elimination of the short-call book removes both the forced-buying engine and the structural ceiling simultaneously. Price can retrace sharply into the following Monday because the mechanical support from dealer forced-buying has disappeared with the expiring contracts. Anticipating this termination — and exiting before it — is the single most important timing discipline in gamma squeeze trading.
Trading the Gamma Squeeze: Entry, Sizing, and Exit
The gamma squeeze framework is most valuable as a pre-positioning tool, not a reactive trade. Buying into an already-accelerating cascade is one of the highest-risk trades in options markets — you are paying for gamma that is already partially realized, with exhaustion potentially only one session away. The optimal approach is to identify the setup in Phase 1–2, enter a small initial position in late Phase 2, and execute the primary entry on the Phase 3 trigger confirmation.
Entry Protocol
- Confirm the four-signal framework scores 3/4 or 4/4. Net GEX deeply negative, call wall within 2–3% of spot, per-strike PCR < 0.5 at the dominant call wall, ZGL within 1–2%. Do not enter before this threshold is reached — call wall compressions in positive-GEX regimes produce false squeeze signals with high frequency.
- Identify the trigger level. The ZGL is the primary trigger threshold. Map it precisely using the StrikeWatch EA Summary Surface. The dominant call wall strike is the secondary trigger — a confirmed close above it on volume adds conviction. Do not use intraday wicks through the ZGL as confirmation; require a closing print above with above-average volume.
- Enter on ZGL breach confirmation. Once price closes above the ZGL on above-average volume, the regime has flipped. Enter using a long call (short DTE, 0.40–0.55 delta at entry) or long underlying with tight stop below the ZGL. For defined-risk setups, a debit call spread with the long strike at current spot and the short strike at the next major call wall above captures the squeeze range with capped risk.
- Confirm with Real-Time Options Tape. The 30 largest options prints on the tape should show aggressive call buying (fills at the ask) at near-money strikes. If the tape shows predominantly put-buying or mixed flow, the breakout may be structural noise rather than gamma-driven. Wait for tape confirmation before adding to the position.
Sizing Framework
| Phase at Entry | Signal Confidence | Recommended Initial Size | Add Condition |
|---|---|---|---|
| Phase 2 Pre-position | 4/4 signals, compression visible | 25–30% of intended full size | Add to 60% on ZGL breach confirmation. Add remainder on cascade continuation confirmation (next session open above the trigger level). |
| Phase 3 Trigger | ZGL breach + volume + tape confirmation | 50–60% of intended full size | Add remaining 40% on next session open IF price holds above the ZGL and volume sustains. Do not add into gap-up opens that immediately begin fading. |
| Phase 4 Cascade | Squeeze in progress, price accelerating | No new additions | You are late. The forced-buying flow has partially exhausted. Any new entry here is chasing gamma that is being realized, not gamma that is about to be realized. |
Exit Protocol
- Primary exit: Exhaustion signals. Volume decelerating on up-moves, price advancing in smaller increments per unit of volume, options spreads widening as dealers re-price, GEX profile shifting (negative GEX bar at the trigger call strike shrinking or disappearing). Reduce 50–75% of the position when two of these four signals appear simultaneously.
- Time-based exit: DTE approaching zero. If the squeeze was OPEX-driven and is nearing expiration Friday, close all positions no later than 2 hours before market close on expiration day. Post-close settlement mechanics and after-hours movement create pin risk and assignment uncertainty. For the complete framework on pin risk and expiration-day mechanics, see Options Expiration Cycle: OPEX, Gamma Dynamics, Assignment & Pin Risk.
- Structural stop: Below the ZGL. A confirmed close back below the Zero Gamma Level invalidates the squeeze premise — the regime has reflipped to stabilizing dealer hedging. Exit the remaining position. The mechanical amplifier is no longer active.
- Target: Next major call wall. The next dominant call wall above the trigger strike is the natural structural ceiling for the squeeze — dealer short calls at that higher strike will begin creating mechanical resistance, potentially absorbing the cascade. Use the Strike Wall score of that next wall to calibrate how much resistance to expect. A 4/4 wall above is a hard ceiling; a 2/4 wall above may be breached in a strong cascade.
Post-Squeeze Structural Reset
One of the most reliably misread events in options trading is the post-squeeze structural reset. Traders who rode the cascade successfully assume the breakout has created a new structural floor — that the former call wall resistance has now flipped to support. Sometimes it has. But in a gamma-squeeze context specifically, the support that existed during the cascade was mechanical dealer buying, not genuine price discovery or institutional accumulation. When that buying stops — because gamma exhausted or the options expired — the support disappears with it.
The post-squeeze environment has three distinct structural characteristics:
- Gamma cliff. Post-OPEX, 20–50% of total OI rolls off. The dealer gamma exposure that powered the squeeze vanishes. The market loses structural guardrails simultaneously in both directions — it becomes directionless until new OI accumulates in the next cycle.
- Max Pain recalibration. The extreme squeeze move often shifts the new cycle's Max Pain level significantly higher than the prior cycle's equilibrium. New open interest accumulates at strikes reflecting the post-squeeze pricing level. The fresh structural map must be built from this new reference point.
- 40–60% mean-reversion window. Empirically, large gamma squeezes are followed by a retracement of 40–60% of the squeeze range within 1–3 sessions in the absence of a continuation catalyst. This is not a directional prediction — it is the structural consequence of a mechanical buying floor dissolving. Traders who do not exit before exhaustion often give back the majority of squeeze gains in this window.
The most common post-squeeze error is treating the squeeze peak as a new
technical base and buying the first dip after exhaustion. If the dip coincides
with the post-OPEX gamma cliff, there is no mechanical buyer
supporting it — only natural demand, which must be verified independently from
the new cycle's OI and GEX data.
Wait for the new expiration cycle's OI to accumulate (typically 5–7
trading days post-OPEX) before treating post-squeeze levels as structurally
confirmed support. Until then, apply the
post-OPEX
window-of-weakness framework and trade with reduced size.
Common Errors in Gamma Squeeze Analysis
- Confusing a compression phase (Phase 2) with a failed squeeze. The compression phase — where price oscillates below the call wall with narrowing ranges — is not a sign that the squeeze won't happen. It is the coiling phase. Multiple failed rally attempts into the call wall in Phase 2 are typical; they represent the pin mechanics of a positive-GEX regime, not the squeeze activation. The squeeze activates when the ZGL is breached, not when the call wall is approached.
- Entering pre-trigger based on the four signals alone. A 4/4 pre-squeeze diagnostic identifies the setup. It does not confirm the trigger. Entering a full-size long before the ZGL breach exposes you to the full premium decay of the compression phase, which can last days. Enter a small starter position only; hold the primary entry for the confirmed trigger.
- Applying the squeeze framework in positive-GEX regimes. In positive-GEX environments (spot above ZGL), call wall breakouts are absorbed by dealer selling of the underlying — the opposite of a squeeze. Call wall breaches in positive GEX typically fail and reverse. The squeeze framework requires negative GEX as Signal 1. Without it, the entire mechanical basis for forced-buying amplification is absent.
- Adding size in Phase 4 (Cascade). Buying into an already-accelerating gamma cascade is late entry by definition. The forced-buying flow is being realized, not loading. Gamma is actively exhausting. Adding in Phase 4 means entering with the highest possible premium paid, the shortest remaining time until exhaustion, and the smallest remaining forced-buying engine. This is statistically the worst-timed entry in the six-phase lifecycle.
- Ignoring the distinction between upside and downside squeezes. The two types require entirely different detection and trading approaches. Using an upside-squeeze entry framework (long calls on call wall break) on what is actually a forming downside cascade (dealers short puts with spot above a major put floor) produces systematic losses.
- Not closing before OPEX expiration. Options positions held through expiration on a gamma-squeezed underlying face pin risk, after-hours exercise decisions, and potentially assignment on short legs of spreads. The squeeze trade is a short-to-medium-term options position, not a buy-and-hold. The OPEX-day close window is the structural deadline.
- Treating every call wall breakout as a gamma squeeze. Call walls break in positive-GEX regimes, on strong catalysts, and during trend continuation without any squeeze mechanics being active. The squeeze framework specifically requires negative-GEX amplification. Without Signal 1 (deeply negative net GEX) confirmed, a call wall break is a directional momentum trade, not a gamma squeeze, and should be managed accordingly.
- Ignoring the Max Pain reset post-squeeze. After a violent upside squeeze, Max Pain for the next expiration cycle recalibrates at a significantly higher price level. Traders who apply the old Max Pain level as a mean-reversion target are using a structural reference that no longer exists in the new cycle's OI distribution.
Gamma Squeeze Analysis in StrikeWatch EA
StrikeWatch EA is designed to surface all four pre-squeeze signals and the complete Phase 3–5 monitoring framework directly inside MetaTrader 5. No manual calculation is required for any element of the four-signal diagnostic:
- Net GEX and GEX Profile by Strike (Signal 1 + Squeeze Location) — The Summary Surface displays real-time net GEX alongside the full GEX histogram by strike. Deeply negative net GEX (Signal 1) is immediately visible from the bar color and magnitude. The strike with the largest negative GEX bar identifies where dealer short-gamma exposure is most concentrated — the precise location where a breakout would trigger the most violent forced-buying flow.
- OI/Volume Statistics — Call Wall Concentration (Signal 2) — The Top 15 Strikes module ranks all strikes by OI, instantly identifying the dominant call walls above spot. The DTE-adjusted OI display shows which of those concentrations are live (active GEX) vs. dead (residual OI without gamma). For the full live vs. dead wall diagnostic, see Open Interest vs. Volume Explained.
- Per-Strike PCR (Signal 3) — The PCR column in the OI/Volume Statistics module displays the put/call ratio at each of the Top 15 strikes. A per-strike PCR below 0.5 at the dominant call wall confirms dealer short-call positioning at exactly the level where the squeeze would originate. This is the most operationally critical column for squeeze detection — it differentiates a genuine squeeze precondition from OI concentration that has no directional dealer character.
- Zero Gamma Level On-Chart (Signal 4) — The ZGL is plotted as a dynamic horizontal line directly on the MT5 price chart, updated continuously as OI changes. The distance between current spot and the ZGL is displayed as a percentage, enabling instant Signal 4 assessment without calculation. When spot is within 1–2% below the ZGL, the trigger proximity is live.
- Real-Time Options Tape — Trigger Confirmation — The last 30 largest options prints with aggressor-side classification (ask-side = aggressive buying, bid-side = selling/closing) confirm whether a ZGL breach is driven by genuine institutional call buying (squeeze confirmation) or by automated hedging flows and noise. A genuine Phase 3 trigger shows concentrated ask-side call buying at near-money strikes on the tape.
- OPEX Countdown — Gamma Acceleration Context — The interface displays the current DTE to the nearest expiration and the temporal phase (Building / Peak / Dissolving), providing instant context for whether the gamma acceleration factor is 1× (7+ DTE) or 5–10× (0–3 DTE). A 4/4 squeeze setup at 0–2 DTE is a categorically different risk/reward profile from the same setup at 7 DTE.
- Max Pain — Post-Squeeze Target and Reset Reference — The on-chart Max Pain level provides both a structural target for the squeeze cascade (when Max Pain sits above current spot, the payout mechanics are aligned with the directional move) and a reset reference after OPEX (the new cycle's Max Pain identifies where the next structural equilibrium is forming).
A gamma squeeze is mechanical, not random. It is the
deterministic consequence of dealer short-gamma scaling non-linearly as price
approaches concentrated call-OI strikes in a negative-GEX regime. Understanding
the structural preconditions transforms it from a surprise into a
predictable setup.
The four-signal diagnostic is the entry gate. Deeply negative
net GEX (Signal 1) + concentrated call OI within 2–3% of spot (Signal 2)
+ per-strike PCR < 0.5 at the dominant call wall (Signal 3) + ZGL within
1–2% of spot (Signal 4). Four signals = maximum conviction. Three signals =
wait for the trigger. Fewer than three = no squeeze setup is active.
The ZGL breach is the trigger, not the call wall approach.
The compression phase (Phase 2) produces repeated failed rally attempts into
the call wall — these are not failed squeezes, they are the coiling
mechanism. The squeeze activates on a confirmed closing print above the Zero
Gamma Level on above-average volume, with ask-side call buying on the tape.
Size in phases, not all at once. 25–30% pre-position in
Phase 2 if 4/4 signals confirmed. Add to 60% on the Phase 3 ZGL breach.
Add the remainder on cascade continuation only. Never add in Phase 4 —
you are buying exhausting gamma at peak premium.
OPEX timing is the amplifier. The same setup at 0–2 DTE
carries 5–10× the gamma amplification of the same setup at 7 DTE.
Monthly and quarterly OPEX windows are the highest-probability gamma squeeze
events of the calendar. The gamma cliff after expiration is the natural
termination mechanism — exit before it, not after.
The post-squeeze mean-reversion trap is real.
A 40–60% retracement of the squeeze range within 1–3 sessions
post-exhaustion is the structural norm, not an anomaly. The mechanical buying
floor disappears with the gamma. Close before exhaustion signals; do not
treat the squeeze peak as a new structural support until the next OI cycle
has had 5–7 sessions to accumulate.