The Four Building Blocks
Every options strategy ever invented — from simple covered calls to complex iron condors — is built from combinations of just four fundamental positions. Before studying any multi-leg strategy, you must understand what happens to each of these positions as the underlying price moves.
If any of the foundational concepts behind these positions — calls, puts, premium, expiration, or intrinsic value — are still new to you, start with the Options Trading for Beginners guide before continuing. This article assumes you understand what a call and put are and focuses entirely on the mechanics of how each position behaves in motion.
We will use a concrete example throughout: AAPL trading at $200, with ATM options (strike $200) priced at $5.00 per share ($500 per contract). The implied volatility is 25%, and there are 30 days to expiration.
For each position, we will examine:
- What happens when the stock moves $1, $5, and $10 in your favor
- What happens when the stock moves $1, $5, and $10 against you
- How the Greeks (Delta, Gamma, Theta) shape the P&L at each point
- The breakeven point and probability of profit
- The worst-case scenario
Position 1: Long Call (Buy Call)
Market view: Bullish — you expect the stock to rise.
Entry: Buy 1 AAPL $200 Call at $5.00. Cost: $500.
Initial Greeks: Delta +0.50, Gamma +0.03, Theta −0.08 ($8/day decay).
Stock Rises (Favorable)
- +$1 (AAPL at $201): Your call gains approximately $0.50 (Delta × $1 = +$50 per contract). The option is now worth ~$5.50. Delta increases to ~0.53 due to Gamma. You are now more sensitive to further upside — each subsequent dollar gains more. Your P&L: +$50 (−$450 net, not yet profitable).
- +$5 (AAPL at $205): The option is now ITM. With Gamma accelerating Delta toward ~0.70, the call is worth approximately $7.20. Your P&L: +$220. You have passed the breakeven ($205 = strike + premium). Every additional dollar now generates ~$0.70.
- +$10 (AAPL at $210): The call is deep ITM with Delta approaching ~0.85. The option is worth approximately $11.50. Your P&L: +$650 — a 130% return on your $500 investment. The leverage effect is dramatic: a 5% stock move generated a 130% option return.
Stock Falls (Adverse)
- −$1 (AAPL at $199): Your call loses approximately $0.50 (−$50 per contract). Delta decreases to ~0.47. The option is worth ~$4.50. Theta continues to erode: you lose $8 per day on top of the directional loss.
- −$5 (AAPL at $195): The call is OTM. Delta has decreased to ~0.30. The option is worth approximately $2.30. Your P&L: −$270. Notice the self-limiting property: as the stock falls, your Delta decreases — you lose less per additional dollar of decline.
- −$10 (AAPL at $190): The call is far OTM. Delta is ~0.15. The option is worth approximately $0.80. Your P&L: −$420. Close to maximum loss, but notice you still have $80 of remaining value and the stock would need to stay below $205 at expiration for the trade to be a total loss.
Worst case: AAPL drops significantly or stays below $205 at expiration. Maximum loss: $500 (the premium paid). This is defined and cannot be exceeded.
Position 2: Short Put (Sell Put)
Market view: Bullish to neutral — you expect the stock to stay flat
or rise.
Entry: Sell 1 AAPL $200 Put at $5.00. Credit received: $500.
Initial Greeks: Delta +0.50, Gamma −0.03, Theta +0.08 ($8/day earned).
Stock Rises (Favorable)
- +$1 (AAPL at $201): Your short put gains approximately $0.50 ($50 per contract) because the put loses value. The put is now worth ~$4.50; since you sold at $5.00, your P&L: +$50. Plus Theta is earning ~$8/day for you.
- +$5 (AAPL at $205): The put is OTM. Its value has dropped to approximately $2.20. Your P&L: +$280. Theta is now accelerating in your favor as the put moves further OTM.
- +$10 (AAPL at $210): The put is far OTM, worth approximately $0.60. Your P&L: +$440. You have captured nearly all of the $500 premium. However, note the asymmetry: even though the stock rose 5% (same as the long call scenario), your profit is capped at $440 vs. the long call’s $650. This is the fundamental trade-off.
Stock Falls (Adverse)
- −$1 (AAPL at $199): Your short put loses approximately $0.50 (−$50 per contract). The put is worth ~$5.50. Your P&L: −$50. But Theta is still working for you — you earn ~$8/day, partially offsetting the directional loss.
- −$5 (AAPL at $195): The put is ITM. Delta has increased to ~0.70. The put is worth approximately $8.00. Your P&L: −$300. Unlike the long call scenario (where losses self-limit due to falling Delta), the short put’s losses accelerate as the put moves ITM because Gamma is increasing your Delta exposure.
- −$10 (AAPL at $190): The put is deep ITM. Delta approaches −0.85 (your Delta as seller is +0.85). The put is worth approximately $11.50. Your P&L: −$650. The loss now exceeds the long call’s maximum loss of $500. This is the short put’s defining risk: losses can exceed the premium received multiple times over.
Worst case: AAPL drops toward zero. Maximum loss: $19,500 (strike $200 × 100 shares − $500 premium received). Realistically, a 20% crash to $160 would generate a loss of approximately $3,500 — seven times the premium collected.
Position 3: Long Put (Buy Put)
Market view: Bearish — you expect the stock to fall.
Entry: Buy 1 AAPL $200 Put at $5.00. Cost: $500.
Initial Greeks: Delta −0.50, Gamma +0.03, Theta −0.08
($8/day decay).
Stock Falls (Favorable)
- −$1 (AAPL at $199): Your put gains ~$0.50 (+$50 per contract). Delta strengthens to ~−0.53. The put is worth ~$5.50. P&L: +$50.
- −$5 (AAPL at $195): The put is ITM. Delta has strengthened to ~−0.70. The put is worth approximately $7.80. P&L: +$280. You have passed breakeven ($195 = strike − premium).
- −$10 (AAPL at $190): The put is deep ITM. Delta approaches −0.85. The put is worth approximately $11.50. P&L: +$650. A 5% stock decline generated a 130% return on your $500 investment — the identical leverage ratio as the long call on the upside.
Stock Rises (Adverse)
- +$1: Put loses ~$0.50. P&L: −$50. Delta weakens to −0.47.
- +$5: Put is OTM, worth ~$2.20. P&L: −$280. Delta has weakened to −0.30 — losses are self-limiting.
- +$10: Put is far OTM, worth ~$0.60. P&L: −$440. Close to maximum loss.
Worst case: Stock rallies strongly. Maximum loss: $500 (the premium paid). Same defined-risk characteristic as the long call.
Position 4: Short Call (Sell Call)
Market view: Bearish to neutral — you expect the stock to stay flat
or decline.
Entry: Sell 1 AAPL $200 Call at $5.00. Credit received: $500.
Initial Greeks: Delta −0.50, Gamma −0.03, Theta +0.08
($8/day earned).
Stock Falls (Favorable)
- −$1: Your short call gains ~$0.50 (+$50) as the call loses value. Theta earns ~$8/day. P&L: +$50.
- −$5: Call is OTM, worth ~$2.20. P&L: +$280.
- −$10: Call is far OTM, worth ~$0.60. P&L: +$440. Nearly full premium captured.
Stock Rises (Adverse)
- +$1: Short call loses ~$0.50 (−$50). Delta strengthens to −0.53 (your exposure worsens). P&L: −$50.
- +$5: Call is ITM. Delta approaches −0.70. The call is worth ~$7.80. P&L: −$280. Losses are accelerating because Gamma is increasing your Delta exposure.
- +$10: Call is deep ITM. Delta approaches −0.85. Call worth ~$11.50. P&L: −$650. And there is no floor — if the stock continues rising, losses continue growing.
Worst case: Stock rallies to infinity (theoretically). A 50% rally to $300 on a naked short call at $200 generates a loss of $9,500 (($300 − $200) × 100 − $500 premium). This is why naked short calls are the most dangerous single-leg position in options trading. Position sizing that accounts for the full range of adverse outcomes — including how to set maximum loss thresholds per position and per day — is covered in the Position Sizing Around GEX and Volume Floors guide.
The Greeks in Action: Key Relationships
Understanding the four positions requires internalizing these key Greeks relationships:
- Delta determines your directional exposure. Long calls and short puts have positive Delta (profit from rising prices). Long puts and short calls have negative Delta (profit from falling prices). The magnitude of Delta at entry determines how aggressively you participate in the move.
- Gamma determines whether your losses self-limit or accelerate. Option buyers (long call, long put) have positive Gamma — as the trade goes against them, their Delta decreases, automatically reducing their loss rate. Option sellers (short call, short put) have negative Gamma — as the trade goes against them, their Delta increases, accelerating their losses. This is the single most important structural difference between buying and selling options.
- Theta determines who time favors. Buyers pay Theta — their options lose value every day, all else being equal. Sellers earn Theta — time decay is their primary profit mechanism. For ATM options 30 days from expiration, Theta is approximately 0.05–0.10 per day, meaning the option loses $5–$10 per contract per day from time decay alone.
- Vega determines your volatility exposure. Buyers are long Vega — they benefit when IV increases. Sellers are short Vega — they benefit when IV decreases. In practice, this means buying options before an expected volatility event (earnings, FOMC) and selling after the event when IV crushes.
These Greek relationships are constant across all moneyness zones, but their magnitude changes significantly as an option moves from OTM to ATM to ITM. Gamma and Vega are highest at-the-money; Delta approaches 1.0 for deep ITM options; Theta is most destructive at ATM. The complete breakdown of how each Greek scales across strike zones — and what this means for strategy selection by moneyness — is in the Options Moneyness guide.
Decision Criteria: Selecting the Right Position
Before entering any option position, answer these five questions — each one narrows your choice:
- What is my directional view? Bullish → long call or short put. Bearish → long put or short call. Neutral → short straddle/strangle (advanced, covered separately).
- How big is the expected move? Large move → buy options (capture unlimited upside). Small or no move → sell options (harvest Theta from stagnation).
- What is the IV environment? Check StrikeWatch EA’s IV vs. HV in the Summary Surface. High IV (options expensive relative to realized moves) → sell premium. Low IV (options cheap) → buy premium. The complete framework for reading the IV–HV spread and using IV Rank and IV Percentile as strategy filters is in the Implied vs. Historical Volatility guide.
- What is my risk tolerance? Defined risk → buy options (maximum loss = premium). Willing to take assignment risk or larger losses → sell options, but use defined-risk spreads wherever possible to cap the adverse tail.
- What is the gamma regime? Check StrikeWatch EA’s Net GEX. Positive GEX (above the Zero Gamma Level) → rangebound, theta-friendly → sell premium. Negative GEX (below ZGL) → volatile, gamma-friendly → buy options for directional trades. The full mechanics of how the GEX regime determines follow-through are in the Dealer Hedging Regimes & GEX guide.
The Four Positions Inside StrikeWatch EA
StrikeWatch EA equips you to analyze each position before entry:
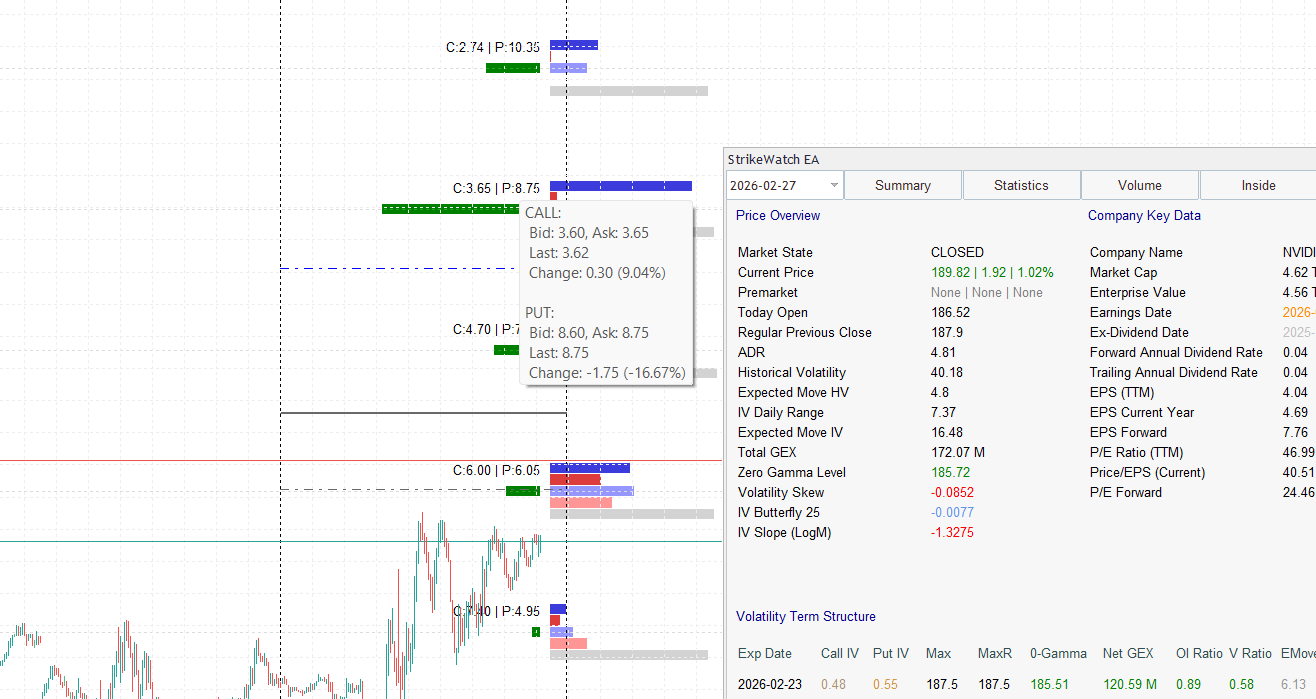
- X-Ray Tooltips: Hover over any strike to see Delta, Gamma, Theta, IV, and Bid/Ask in a pop-up card. Know your exact exposure before you trade.
- Expected Move Overlay: The IV-based and HV-based Expected Move bands on the chart show you the statistical range of probable price movement. If the Expected Move does not reach your option’s breakeven, the trade has negative expected value.
- IV vs. HV Dashboard: Instantly determine whether options are cheap (buy) or expensive (sell) based on the real-time IV–HV spread and IV Rank.
- Net GEX & ZGL: Know whether the market structure supports your position. Buying calls in a positive GEX regime (above ZGL) means dealers are mechanically supporting your trade. Buying puts in negative GEX (below ZGL) means dealers are amplifying your directional move.
- Volume Profile: Identify where institutional volume is concentrated. Enter long positions at High-Volume Nodes (support) and target Low-Volume Nodes (price acceleration zones).
Once you are comfortable with the four standalone positions, the natural progression
is combining them into multi-leg structures that control risk and
monetize specific market conditions:
• Options Flow Intelligence
Framework — how to read institutional positioning to identify
which directional bias has the highest follow-through before selecting
your position.
• Position
Sizing Around GEX and Volume Floors — scaling position size to
the current regime and setting drawdown rules that keep losses
structurally bounded.