Why Equity Skew Is Persistently Negative
In a world governed purely by the Black-Scholes model, all options on the same underlying and expiration would share identical implied volatility regardless of strike price. The real world is profoundly different. Since the 1987 crash, equity markets have exhibited a persistent negative skew — out-of-the-money puts carry higher implied volatility than equivalent OTM calls. This is not a market anomaly waiting to be arbitraged away. It is a permanent structural feature with three reinforcing causes.
- Crash risk pricing: Equity returns exhibit negative skewness and excess kurtosis — crashes are larger and faster than rallies. OTM puts must carry higher IV to reflect the genuine probability of extreme left-tail events that the log-normal distribution of Black-Scholes systematically underestimates. Bates (2003) documented that the post-1987 skew represents the market’s permanent incorporation of jump risk into option pricing — a regime shift that has not reverted in four decades.
- Structural demand imbalance: Institutional portfolio managers are systematic, persistent buyers of downside protection. Pension funds, endowments, and insurance companies have regulatory mandates to hedge equity exposure. This creates a supply-demand imbalance that cannot be arbitraged: there are always more natural buyers of puts than natural sellers, driving put IV structurally higher relative to call IV.
- Leverage constraints: Rubinstein (1994) demonstrated that in markets with leverage constraints, investors who cannot fully lever their portfolios substitute OTM call buying for margin-based equity exposure. In practice, however, the hedging demand for puts (driven by regulatory mandates) consistently exceeds call demand (driven by leverage substitution), maintaining the negative skew even in bull markets.
The Post-1987 Structural Change
Before October 1987, equity options markets exhibited a nearly flat skew — options traders priced OTM puts and calls with approximately equal implied volatility, consistent with Black-Scholes assumptions. The 22.6% single-session decline on Black Monday permanently changed this. Dealers and market makers who had sold OTM puts without adequate hedging suffered catastrophic losses. The structural lesson was permanent: OTM put sellers now demand a substantial premium above fair value to compensate for gap risk, and institutional buyers are perpetually willing to pay it. The negative skew that emerged in late 1987 has been a constant feature of equity options markets ever since.
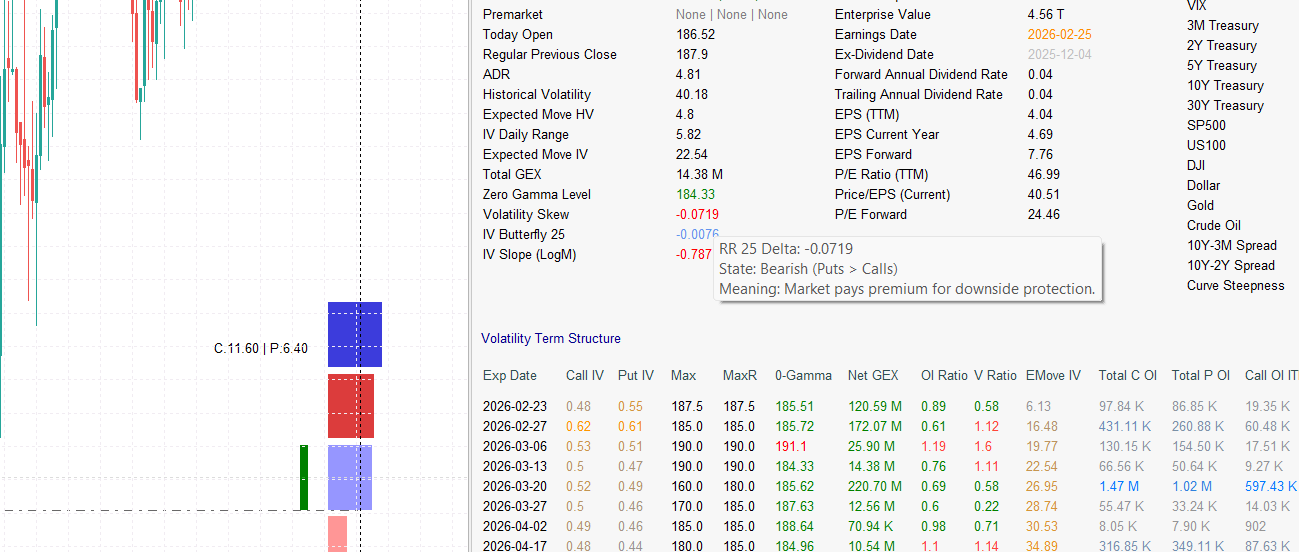
The 25-Delta Risk Reversal: The Market’s Directional Barometer
The industry-standard metric for measuring equity skew is the 25-Delta Risk Reversal (25Δ RR) — a single number that distills the entire relative pricing of downside vs. upside into one tradeable reference:
25Δ RR = IV(25Δ Call) − IV(25Δ Put)
A negative value means puts are more expensive than calls — the normal state for equities. A positive value means calls are more expensive — indicating upside demand, squeeze dynamics, or an unusual bullish catalyst. The magnitude measures how extreme the asymmetry is. The change over time carries the directional signal.
The 25-delta strikes are chosen by convention because they represent a standardized OTM distance: roughly one standard deviation away from ATM in each direction. This makes the metric directly comparable across different underlying prices and volatility regimes. A stock trading at $50 and a stock at $500 can be compared by their 25Δ RR without adjustment.
Reading the Signal: Change Over Level
For directional purposes, the change in the 25Δ RR is more informative than its absolute level. A stock may habitually trade at −8% due to its structural hedging demand — that level tells you nothing actionable. What matters is whether the 25Δ RR is moving toward −12% (fear building) or toward −4% (fear dissipating):
- 25Δ RR becoming more negative (e.g., moving from −3 to −7): Institutional demand for downside protection is surging. Funds are aggressively buying puts. This is a risk-off signal that typically leads realized downside by 3–10 trading days — the hedge is being placed before the anticipated move, not in response to it.
- 25Δ RR becoming less negative (e.g., moving from −7 to −3): Fear is dissipating. Put holders are closing protection. Dealers who were short puts are buying back their delta hedges, creating reflexive buying pressure in the underlying. This is a risk-on signal — the mechanical unwind of put hedges supports price.
- 25Δ RR turning positive (rare in equity indices, more common in single stocks): Call demand exceeds put demand. This is the signature of a momentum or squeeze dynamic — speculative call buying is driving upside demand beyond the natural hedging supply. Historically associated with meme stock dynamics, short-squeeze setups, and takeover speculation.
Skew vs. ATM IV Level: Two Different Signals
Skew and the overall implied volatility level (IVR/IVP) measure fundamentally different things and must not be conflated. IV level answers the question: how much volatility is the market pricing overall? A high IVR means all options are expensive across the board — puts, calls, and ATM alike. The Volatility Risk Premium is wide. Skew answers a different question: of that total volatility budget, where is it concentrated? A steep negative skew with moderate IV level means the market is not necessarily panicking — it is specifically pricing downside risk more than upside. A flat skew with extreme IV level means the market expects a very large move but has no directional conviction about which way.
| IV Level (IVR) | 25Δ RR | Market Reading | Implication |
|---|---|---|---|
| High (>50) | Steep negative (<−10%) | General fear + downside-specific hedging | Maximum structural vulnerability below; avoid short puts |
| High (>50) | Near zero (−3 to 0) | High vol expected, no directional bias | Sell straddles only with defined risk; vol is rich but directionally neutral |
| Low (<25) | Steep negative (<−8%) | Options cheap overall but downside insurance in demand | Buy puts at discount relative to their risk value; tail hedge is cheap |
| Low (<25) | Near zero / positive | Complacency; no directional fear in any direction | Long straddles; IV likely to expand from mean; lowest-risk long-vol entry |
The 25-Delta Butterfly: Kurtosis and Tail Risk
The 25Δ RR measures the direction of the skew — which tail is more expensive. The 25-Delta Butterfly measures a different dimension: how expensive both tails are relative to the center of the distribution, regardless of direction. It is a pure kurtosis signal:
25Δ Butterfly = ½ × (IV(25Δ Call) + IV(25Δ Put)) − IV(ATM)
A high butterfly value means the market is pricing fat tails in both directions — the realized return distribution is expected to have heavier tails than a normal distribution predicts. Cont and da Fonseca (2002) identified curvature as the third principal component of IV surface dynamics, responsible for 5–8% of daily surface variation but carrying disproportionate information during regime transitions.
The Butterfly as a Pre-Event Indicator
The butterfly is particularly powerful as an early warning signal because it rises before moves materialize — informed traders buy both tails when they anticipate a large move but are uncertain about direction:
- Rising butterfly before earnings: The market is pricing a large move but is genuinely uncertain about direction. Straddle buyers are willing to pay premium for both sides. This signals that the earnings result is consequential and the implied move is worth trading — either as a straddle buyer (if you expect the move to exceed the priced EM) or as a seller (if you expect IV crush to exceed the actual move).
- Rising butterfly without a known catalyst: More ominous. When tail pricing increases without an identifiable event, informed traders may be positioning for a catalyst that is not yet public. This pattern has historically preceded M&A announcements, regulatory decisions, and macro surprises by several sessions.
- Collapsing butterfly post-event: The tails are repriced lower as uncertainty resolves. This is the kurtosis component of IV crush — the effect that benefits straddle sellers even when the actual price move partially exceeds the expected range.
The Four-Quadrant Skew Regime Map
Combining the 25Δ RR (direction of skew) and the 25Δ Butterfly (magnitude of tail pricing) creates a four-quadrant regime classification that maps any market condition to a specific structural environment and optimal strategy response:
| 25Δ RR | 25Δ Butterfly | Regime | Structural Interpretation | Strategy |
|---|---|---|---|---|
| Steep negative (<−8%) | High (>90th percentile) | Crash Fear | Maximum downside hedging demand + extreme tail pricing. Historically precedes sharp selloffs. | Avoid short volatility; consider risk reversals (long puts, short calls); reduce net delta |
| Steep negative (<−8%) | Low (<50th percentile) | Orderly Protection | Consistent hedging demand without panic pricing. Normal institutional risk management. | Sell put spreads to harvest the structural put premium; VRP available without extreme tail risk |
| Flat / Positive (>−3%) | High (>90th percentile) | Squeeze Setup | Upside call demand elevated alongside fat tail pricing. Short-squeeze and momentum dynamics. | Defined-risk call debit spreads; participate in directional momentum, limit exposure to mean reversion |
| Flat / Positive (>−3%) | Low (<50th percentile) | Complacency | Neither tail is priced richly; no directional hedging demand. Most range-bound environment. | Sell straddles / iron condors aggressively; realized volatility likely to undershoot implied |
These four regimes are not static — they evolve continuously as hedging flows and catalysts shift. The most powerful setups occur at regime transitions: moving from Complacency to Crash Fear in 2–3 sessions is one of the most reliable precursors to a sharp directional move. Moving from Crash Fear to Orderly Protection signals that the worst is priced in and mean-reversion trades become available.
Skew and the GEX Feedback Loop
The skew is not merely an information signal — it directly affects the mechanical behavior of the market through the gamma feedback channel. Understanding this link is what separates reading skew from acting on it.
When the skew is steep (puts are very expensive relative to calls), dealers have sold a disproportionate amount of put gamma. This means their negative gamma exposure is concentrated on the downside. If price drops, dealers must sell stock to maintain delta neutrality — and because put gamma is concentrated at lower strikes, each incremental down-move forces progressively more selling. The steep skew mechanically creates the conditions for accelerated downside moves. The skew told you the structure was dangerous; the GEX regime tells you whether that danger is currently active.
Conversely, when the skew flattens or inverts (calls becoming relatively expensive), dealers accumulate negative gamma on the upside. Rising prices force dealers to buy more stock, and concentrated call gamma amplifies each incremental up-move. This is the structural mechanics behind gamma squeezes — the skew signaled the setup before price confirmed it.
Three-Regime Convergence Matrix
The most actionable skew signals are those confirmed by GEX. The following matrix maps the three most common convergence states across skew and dealer gamma positioning:
| 25Δ RR | Net GEX Regime | Intraday Implication | StrikeWatch EA Signal |
|---|---|---|---|
| Steep negative (<−10%) | Negative (spot below ZGL) | Cascade sell-off risk: institutional put demand + dealer delta-selling amplify every down-tick. Both forces compound each other. | Net GEX red + 25Δ RR extreme → high-alert zone; reduce short-vol exposure immediately |
| Near zero (−3% to 0) | Positive (spot above ZGL) | Range-bound conditions: dealers absorb both sides of the market and skew shows no directional conviction. Optimal premium-selling backdrop. | GEX positive + flat skew → highest-conviction 0DTE credit spread environment |
| Flat / Inverted (>0) | Negative (spot below ZGL) | Gamma squeeze conditions on upside: call gamma accumulation forces dealer buying on up-moves while negative GEX environment amplifies the move | Watch for ZGL breach + call wall breakdown; skew inversion in negative GEX = highest-conviction squeeze setup |
A single skew signal without GEX confirmation is directional intelligence. A skew signal with GEX confirmation is structural risk assessment. The cascade sell-off scenario (steep negative skew + negative GEX) is not simply a prediction that the stock might fall — it describes a mechanical environment where dealer gamma flows will amplify any directional move. Managing position size accordingly is not discretionary caution; it is a quantitative response to a quantified structural condition.
Skew as an Early Warning for Put Wall Hardness
The connection between skew and the Strike Wall framework runs deeper than coincidence. When the 25Δ RR is steeply negative, institutional put buyers are actively adding positions at specific downside strikes — the same strikes that define put walls in the OI distribution. This means a steep negative skew is not merely a fear indicator; it is a real-time signal that put walls are being reinforced. A put wall with a Strike Wall score of 3–4/4 that forms during a period of steep negative skew is structurally harder than the same OI concentration built during a flat-skew environment, because the options embedded in that wall are held by institutions with active hedging mandates — they will not be closed lightly, and the resulting dealer gamma obligations compound the wall’s mechanical resistance.
Trading Skew Dislocations
The most profitable skew trades occur at extremes — when the skew has deviated significantly from its historical norm and is likely to mean-revert. Skew mean-reversion is one of the most consistent phenomena in options markets because the structural forces that create skew (hedging demand, dealer supply) do not permanently shift — they oscillate around a regime-specific equilibrium.
- Sell the skew when it is too steep: If the 25Δ RR is more than 2 standard deviations below its 30-day average, puts are relatively overpriced. Sell put spreads or the risk reversal (sell puts, buy calls). This is not a directional bet on the market going up — it is a pure bet that the skew will normalize. Profit comes from the put premium decaying relative to calls as fear recedes. Confirm that GEX is not deeply negative before selling — a mechanical cascade environment makes skew mean-reversion timing unpredictable.
- Buy the skew when it is too flat: If the 25Δ RR is near its 52-week high (least negative), downside protection is cheap relative to historical norms. Buy puts or the risk reversal (buy puts, sell calls) as a hedge or directional bet. You are buying insurance at a structural discount. The IVR/IVP context tells you whether options are cheap in absolute terms (IVR < 25) or merely cheap on a skew basis despite elevated overall IV.
- Fade butterfly extremes: Sell strangles when the 25Δ Butterfly exceeds its historical 90th percentile — both tails are overpriced, and IV crush will harvest premium from both sides regardless of direction. Buy strangles when the butterfly is below its 10th percentile — the market is underpricing the probability of a large move in either direction. The butterfly at extremes often leads ATM IV expansion by 2–5 sessions.
StrikeWatch EA’s real-time 25Δ RR and Butterfly display in the Summary Surface module lets you monitor these metrics continuously and identify dislocation opportunities as they develop. The IV Slope metric adds a third dimension — confirming whether the surface is in sticky-strike (trending) or sticky-delta (range-bound) mode, which determines how aggressively the skew dislocation will mean-revert. For the complete surface framework that contextualizes these three metrics together, see IV Surface: The Three-Factor Framework.
Skew Intelligence Inside StrikeWatch EA
StrikeWatch EA provides a comprehensive skew monitoring suite directly inside MetaTrader 5:
- 25Δ Risk Reversal: Real-time calculation of the call-put IV differential at the 25-delta level. See instantly whether the market is biased bearish (negative), neutral, or bullish (positive) — and whether it is steepening (fear building) or flattening (fear dissipating) relative to its recent average.
- 25Δ Butterfly: Real-time kurtosis metric showing how expensive both tails are relative to ATM. Detect fat-tail pricing before the move materializes — particularly the “rising butterfly without a catalyst” pattern that precedes unknown catalysts.
- IV Slope: Measures the rate of change of IV across the moneyness spectrum. A steep IV Slope confirms sticky-strike surface dynamics (trending market, skew moves with spot price); a flat slope signals sticky-delta behavior (range-bound market, skew stays anchored to fixed deltas). Knowing the active surface regime calibrates how you interpret changes in the 25Δ RR.
- On-Chart GEX Overlay: Connect the skew signal to the gamma structure. When negative skew and negative net GEX align on the downside, you have the cascade scenario from the convergence matrix above — the highest-risk structural configuration available. The GEX histogram shows exactly which strikes carry the dealer gamma obligations that will amplify any move the skew is warning about.
- Per-Strike IV in OI/Volume Statistics: Hover over any strike to see raw IV — the building block of the skew. This reveals localized anomalies at individual strikes that the aggregate 25Δ RR might smooth over: a single strike with anomalously high IV on the put side is sometimes the first visible sign of institutional block positioning before the aggregate skew metrics respond.
The negative equity skew is structural, not temporary. Post-1987 crash risk
pricing, institutional hedging mandates, and leverage constraints permanently embed higher IV
into OTM puts relative to OTM calls. It will not be arbitraged away because it compensates
for genuine tail risk that Black-Scholes cannot model.
25Δ RR = directional bias; 25Δ Butterfly = tail pricing magnitude.
These two metrics answer different questions. The RR tells you which direction the market fears.
The Butterfly tells you how intensely it fears any extreme move. Both are needed for regime
classification — use the four-quadrant map to identify the current structural environment
before choosing a strategy.
Skew vs. IV level: never conflate them. High IVR means all options are expensive.
Steep negative skew means downside specifically is expensive. A stock can have low IVR and steep
skew simultaneously — cheap options overall but strong directional hedging demand. Read both
signals independently.
Change in skew leads price by 3–10 sessions. Institutions buy puts before
the anticipated move, not in response to it. Rapid steepening of the 25Δ RR is a leading
indicator — act on it before price confirms.
Steep skew + negative GEX = cascade risk. The convergence of institutional
put demand and dealer negative gamma creates a compounding mechanical structure where every
down-tick forces more selling. This combination requires immediate risk reduction or defined-risk
positioning only.
Steep negative skew hardens put walls. OI at downside strikes built during
steep-skew periods is institutionally owned with hedging mandates — it will not be closed
lightly. Cross-reference skew with the Strike Wall score to distinguish structurally defended
floors from statistically derived ones.