The Fragmented Modern Market
The market structure that most traders imagine — a single, centralized exchange where all orders meet — has not existed for decades. Since the implementation of Regulation NMS in 2007, US equity trading has become profoundly fragmented. Orders now execute across 16 lit exchanges, over 30 Alternative Trading Systems (dark pools), and numerous broker-dealer internalizers.
This fragmentation reflects the fundamental tension between two competing objectives: price discovery (the lit market’s function of revealing fair value through visible orders) and execution quality (the dark market’s function of allowing large orders to execute without adverse price impact).
As of 2025, dark pools and off-exchange venues account for approximately 40–44% of total US equity volume. This means nearly half of all trading activity is invisible to you at the time it occurs. You see it only after execution, when the trades are reported to the consolidated tape — by which point the price impact has already been absorbed.
Brugler et al. (2025), published in the Journal of Financial Economics, demonstrated that trades executed in dark pools with greater access restrictions exhibit less information leakage, lower adverse selection risk, and lower post-trade order imbalances — confirming that dark pools serve a genuine market function for institutional participants managing large positions.
How Dark Pools Work
Despite the ominous name, dark pools are not unregulated black markets. They are SEC-registered Alternative Trading Systems operating under specific rules. The key differences from lit exchanges:
- No pre-trade transparency: Orders in dark pools are not displayed in the public order book. A buyer can rest a 100,000-share order without any other participant seeing it.
- Post-trade reporting: Executed trades must be reported to the consolidated tape within 10 seconds, making them visible after the fact but not during the matching process.
- Price improvement: Most dark pools execute at or between the NBBO (National Best Bid and Offer), often at the midpoint, giving institutional participants better average execution prices than they would receive on lit exchanges where their orders would face queue priority and adverse selection.
- Minimum size tiering: Block-focused pools attract the most informed institutional flow; open-access pools may attract more retail-like flow. This distinction matters for interpreting post-trade reports: block-pool prints carry higher informational density than open-access dark pool prints.
The Price Impact Paradox
Why do institutions go to such lengths to hide their orders? The answer is price impact — the single largest cost of institutional trading.
When a pension fund needs to buy 2 million shares of AAPL, displaying that order on a lit exchange would immediately signal to every other participant — including high-frequency traders — that a large buyer exists. The stock price would rise before the fund completes its order, increasing its average execution cost by potentially tens of millions of dollars.
Korajczyk and Murphy (2018) decomposed institutional trading costs into two components: the spread component (the bid-ask spread paid on each execution) and the price impact component (the adverse price movement caused by the information content of the order). Their research showed that price impact is the dominant cost for institutional orders — often 5–10× larger than the spread cost itself.
Dark pools mitigate this by concealing order information until after execution. The paradox: by removing information from the lit market, dark pools improve execution quality for their participants but potentially reduce the informational efficiency of the public price. Brolley and Malinova (2021), modeling the interaction between dark and lit venues, found that the impact on market quality depends critically on which type of traders migrate to the dark pool. When uninformed (low-urgency) traders move to the dark, lit market spreads tighten and quality improves. When informed traders move, price discovery suffers.
Detecting Institutional Dark Pool Activity
You cannot see dark pool orders before they execute. But you can detect their footprint through four observable market signals:
Signal 1: Liquidity Density Anomalies
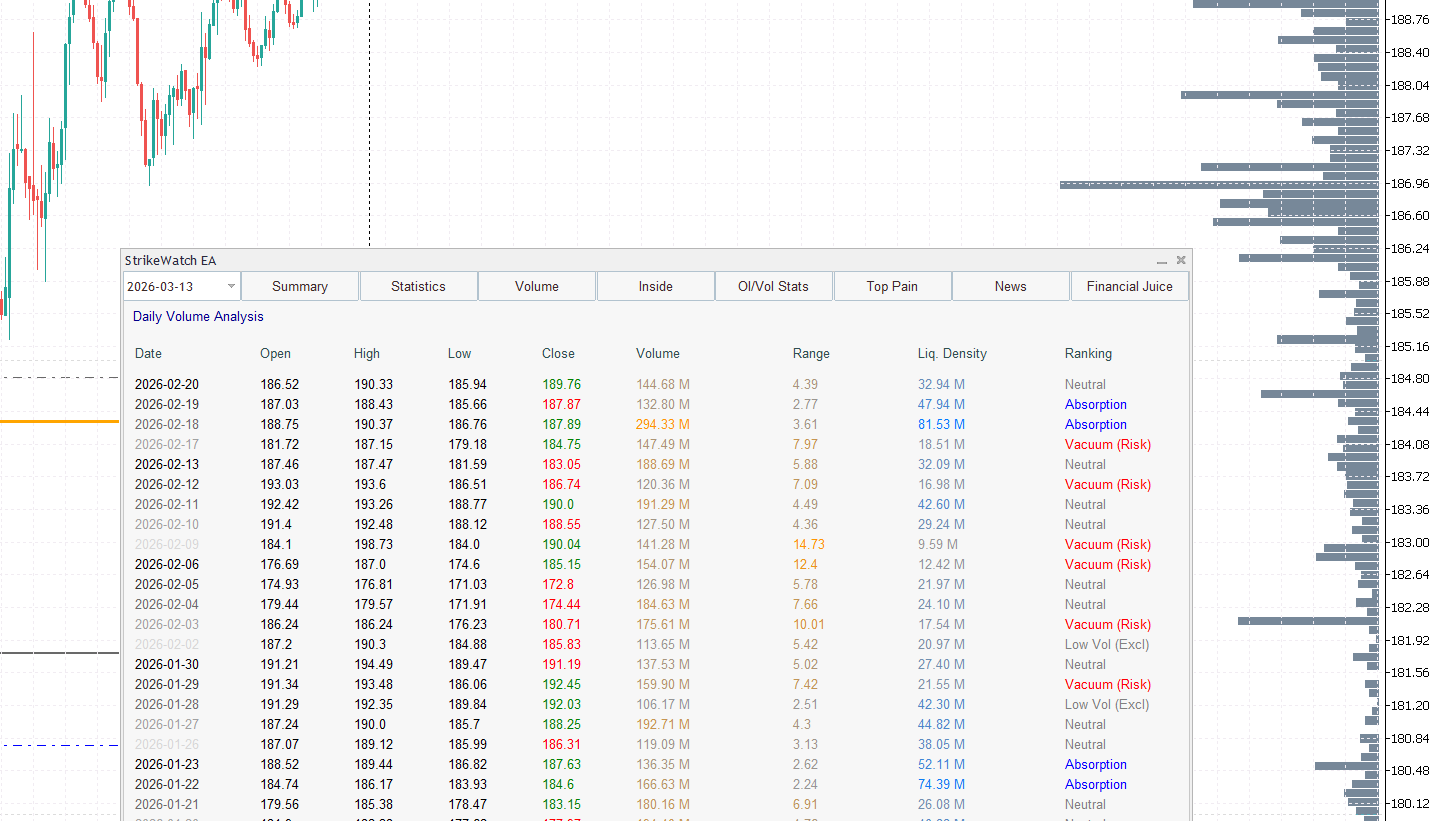
When a stock shows high volume but a narrow price range (high Liquidity Density), it suggests that large orders are being absorbed without moving price — the signature of dark pool or iceberg order activity. StrikeWatch EA’s Volume Intelligence module classifies these sessions as “Absorption” — hidden accumulation that often precedes a directional breakout. The GEX support zones from Dealer Hedging Regimes provide the structural context for where absorption is most likely to occur near mechanically significant levels.
Signal 2: Volume-Depth Divergence
If reported volume significantly exceeds what the visible order book depth would suggest, the excess volume is executing off-exchange. A stock with thin Level 2 depth but unusually high daily volume is being heavily traded in dark venues. This divergence is one of the strongest indirect indicators of institutional dark activity and requires no specialized data feed to identify — only the ability to compare visible depth to reported consolidated tape volume.
Signal 3: VWAP Clustering
Institutional algorithms frequently target Volume-Weighted Average Price (VWAP) as their execution benchmark. When you see consistent buying or selling at prices tightly clustered around the session VWAP — visible in the Volume Profile as a concentration of volume at a specific level — it suggests algorithmic institutional execution split between dark and lit venues. VWAP clustering that persists across multiple sessions is particularly significant: it indicates that a fund is executing a large order over multiple days, each day gravitating toward the VWAP to minimize market impact.
Signal 4: Options-Equity Combo
When a fund accumulates stock in a dark pool, they often simultaneously hedge on lit options exchanges — buying puts or selling calls to manage the directional risk of their growing equity position. The equity leg is invisible; the options hedge is detectable. The complete detection framework for this signal — including the diagnostic criteria that separate a genuine dark pool combo from a standalone put hedge — is covered in Unusual Options Activity §2d: Dark Pool Options Combo.
The Information Hierarchy
Easley, O’Hara, and Srinivas (1998) established the foundational framework for understanding where informed traders choose to trade. Their model demonstrated that informed traders prefer the venue offering the greatest leverage on their information — and for directional bets, options markets provide superior leverage through delta exposure, limited downside, and anonymity.
The modern information hierarchy for institutional positioning follows three sequential stages:
- Options market (first): The informed trader establishes their directional or volatility position via options. This is where the signal appears first because options provide the highest leverage per dollar of capital deployed.
- Dark pools (second): Once the options position is established, the equity leg executes in dark venues to minimize information leakage. The fund accumulates stock hidden from the visible market.
- Lit exchanges (last): Only residual flow — orders too small for dark pools or requiring immediate execution — appears on lit exchanges. By the time you see aggressive buying on the lit order book, the informed trader is likely already fully positioned.
This hierarchy explains why options order flow often leads equity price movement — a finding confirmed by the AEA’s 2026 study on cross-market price discovery and selective delta hedging, which showed that options trades account for a significant share of S&P 500 price discovery, with ITM trades generating the largest price impact through the delta-hedging transmission channel. For the full mechanics of how delta-hedging transmits options flow into equity prices within milliseconds, see Options Order Flow & Market Maker Positioning §1.
Practical Implications for Traders
Understanding market microstructure changes how you interpret every signal on your chart:
- Volume is a confirmation signal, not a leading signal: When you see a high-volume candle, remember that 40%+ of that volume executed in venues you never saw. The volume bar on your chart is a post-hoc reconstruction of executed trades — it confirms that something significant happened, but does not reveal intent or direction. Interpret it as confirmation, not prediction.
- Breakouts need visible-volume validation: A breakout above resistance on high visible volume is structurally stronger than the same breakout on low visible volume, because high lit-exchange volume means urgency is exceeding what dark venues can absorb. Low visible volume breakouts may be dark pool residual flow, which can reverse rapidly once the institutional program completes.
- Options flow is the leading indicator: Given the information hierarchy (options → dark pools → lit exchanges), the options tape provides the earliest detectable signal of institutional intent. For the full framework on reading options tape aggression and classifying flow as directional vs. hedging, see Options Flow Intelligence.
- Absorption precedes direction: When Volume Intelligence flags an “Absorption” session — high volume, narrow range, high liquidity density — a large participant is building a position without moving price. The subsequent breakout direction, when it comes, tends to be powerful and sustained because the absorbed supply or demand is no longer available to oppose the move.
Microstructure Intelligence Inside StrikeWatch EA
StrikeWatch EA does not have direct dark pool feeds — no retail platform does. But it provides every observable signal that reveals institutional dark pool activity:
- Volume Intelligence Module: Liquidity Density classification (Absorption / Vacuum / Valid Move) detects the footprint of hidden institutional accumulation and distribution. The classification runs on tick-level data, not OHLC, making it significantly more sensitive to intraday dark pool patterns than bar-based volume indicators.
- 2-Month Volume Memory: With 7 weeks of tick-level data, multi-week absorption patterns become visible — the signature of a fund slowly building a position across dark venues over multiple weeks. Single-day volume analysis misses this entirely.
- Options Order Flow Tape: The OI&Volume module’s real-time tape shows the visible options leg of institutional positioning. Combining unusual put or call activity on the tape with concurrent equity absorption signals is the closest retail traders can get to seeing the full two-leg institutional trade. The complete detection and execution framework is in Unusual Options Activity §2d.
- GEX + Volume Confluence: The HUD overlays GEX levels alongside volume profiles. When a Volume Profile HVN (institutional acceptance zone) aligns with a high-GEX strike (dealer support zone), you have found a level backed by both the options market structure and the hidden equity accumulation footprint — the strongest structural convergence available from public data.
- Insider Intelligence: SEC Form 4 filings provide a public data point that complements the dark pool signal. If insiders are buying (visible in Form 4) while Volume Intelligence flags multi-session absorption (consistent with dark pool accumulation), the convergence is a high-conviction structural signal that two independent information sources are pointing in the same direction.
40–44% of US equity volume is invisible at execution time.
The volume bar on your chart is a post-hoc report, not a real-time observation. Every
volume-based signal must account for the dark pool fraction that never appeared in the
visible order book before moving price.
Price impact is the dominant institutional trading cost — 5–10×
larger than the spread cost. Dark pools exist because institutions cannot afford to show their
full order on a lit exchange without paying for it in adverse price movement before their
position is complete.
The information hierarchy (options → dark pools → lit exchanges) determines
what leads and what lags. By the time aggressive buying appears on the lit order book,
informed traders are typically fully positioned via options and dark pool equity. The options
tape is the earliest publicly observable signal in the cascade.
Absorption is the observable footprint of dark pool accumulation.
High volume combined with a narrow price range means supply and demand are balancing inside
the dark venues rather than resolving on lit exchanges. The directional breakout that follows
absorption tends to be sharp and sustained because accumulated supply or demand has been
exhausted off-screen.
The options-equity combo signal is the highest-conviction dark pool detection
available without a dark pool feed. Unusual options flow on a lit exchange combined
with equity absorption in the volume profile reconstructs the two legs of the institutional
trade — the detectable hedge and the invisible accumulation.