IVR and IVP: Two Metrics, One Purpose, Different Mechanics
Raw implied volatility is not actionable without historical context. Whether AAPL at 28% IV is “expensive” or “cheap” depends entirely on where 28% falls within AAPL’s own history — not on COIN’s 70% or SPY’s 15%. For the complete framework on why IV requires normalization and how the Volatility Risk Premium creates structural edge for premium sellers, see the foundational reference: Implied vs. Historical Volatility. This article focuses on the operational mechanics: how IVR and IVP are calculated, where they diverge, and how to use them systematically in a multi-stock screening workflow.
Both metrics answer the same question — “Is this stock’s IV high, low, or normal compared to its own history?” — but through fundamentally different mathematical approaches that produce dramatically different readings after a volatility spike.
IV Rank: (Current IV − 52w Low) ÷ (52w High − 52w Low)
× 100
IV Percentile: (Days in past 252 where IV < today’s IV) ÷
252 × 100
The critical difference: IVR uses 2 data points (the 52-week extremes).
IVP uses all 252 daily observations. This distinction drives every divergence
scenario below.
How a Single Spike Breaks IV Rank
IVR’s vulnerability is structural, not incidental. Because the formula uses the 52-week high as the denominator, a single extreme day permanently inflates the ceiling for the following 12 months:
Concrete example: AAPL’s IV spikes to 65% during a one-day panic event (earnings blowout, macro shock). It immediately reverts to 28% and stays there. Three months later, AAPL’s IV is 30% — which is above its pre-spike average of 25%.
- IV Rank: (30 − 18) / (65 − 18) × 100 = 25.5% — signals near-historical-low, favors buying options.
- IV Percentile: IV at 30% is above the vast majority of the past year’s readings. IVP = ~72% — signals elevated IV, favors selling options.
The two signals directly contradict each other because the 65% spike defines the IVR denominator (weight: 100%) but represents only 1 observation out of 252 in the IVP calculation (weight: 0.4%). IVP reflects the true frequency distribution. IVR does not. This distortion persists for the full 52-week window — typically 6–9 months of systematically suppressed IVR readings.
IVR Interpretation Zones
Despite the spike-distortion weakness, IVR remains useful for rapid watchlist scanning. The five operating zones and their strategy implications:
| IVR Zone | Interpretation | Strategy Implication |
|---|---|---|
| 0–20% | IV near 52-week low | Buy premium: long straddles, LEAPS. Avoid selling — premium is thin and the VRP edge is absent. |
| 20–40% | IV below average | Selective selling on high-quality setups only. Good for LEAPS purchases. Confirm with IVP before selling. |
| 40–60% | IV at midpoint | Standard zone for premium sellers. Moderate edge — confirm with IVP > 50 before initiating. |
| 60–80% | IV above average | Favorable for premium selling. Active zone with elevated premium and positive VRP structure. |
| 80–100% | IV near 52-week high | Richest premium, but often driven by imminent catalysts. Check for binary events before selling — rich premium may be fair compensation for real risk. |
After a major volatility event, IVR zones become unreliable for 6–9 months. A stock trading at IVR 15% may actually be at its highest IV in the post-spike normalization period. Always cross-reference with IVP before acting on any IVR reading below 40% following a known spike event.
IVR vs IVP: Feature Comparison
| Feature | IV Rank (IVR) | IV Percentile (IVP) |
|---|---|---|
| What it measures | Position within 52w high–low range | Frequency of lower IV observations |
| Formula inputs | Current IV + 2 data points (52w high, 52w low) | Current IV vs. all 252 daily observations |
| Sensitivity to spikes | HIGH — one spike distorts for up to 12 months | LOW — spike = 1 out of 252 observations (0.4% weight) |
| Post-spike behavior | Reads artificially low for 6–9 months | Reads accurately; spike normalizes within weeks |
| Best use | Rapid watchlist screening; extreme detection (near 0 or 100) | Trade confirmation; robust strategy selection signal |
| Ideal combination | IVR as first-pass filter → IVP as confirmation. When both agree, signal confidence is highest. | |
| Platform availability | Most platforms: thinkorswim (standard IVR formula), tastylive | Option Samurai, tastylive, StrikeWatch EA. Note: some platforms label their IVP calculation as "IV Rank" — verify the underlying formula. |
The Two-Stage Filter: Operational Use of Both Metrics
Rather than choosing one metric over the other, the professional approach uses both in a sequential two-stage filter that exploits IVR’s speed and IVP’s robustness:
- Stage 1 — IVR Quick Screen. Filter your watchlist for IVR > 30 (premium-selling candidates) or IVR < 20 (premium-buying candidates). IVR’s simplicity makes it ideal for scanning hundreds of underlyings in seconds. Discard obvious negatives at this stage.
- Stage 2 — IVP Confirmation. For every stock that passes the IVR screen, verify with IVP. Agreement between the two metrics produces the highest-confidence signal. Divergence requires a diagnostic step before acting.
The Four-Combination Signal Matrix
| IVR | IVP | Interpretation | Action |
|---|---|---|---|
| High (> 50) | High (> 50) | Confirmed expensive. Both range and frequency confirm IV is genuinely elevated. No spike distortion. | Sell premium: credit spreads, iron condors, covered calls. Maximum conviction. |
| Low (< 30) | Low (< 30) | Confirmed cheap. Both metrics agree IV is near historically low levels. | Buy premium: debit spreads, straddles, LEAPS. Maximum conviction for vol expansion trades. |
| Low (< 30) | High (> 50) | Spike distortion. IVR is depressed by an old outlier event; IV is actually elevated on a frequency basis. | Trust IVP — proceed with selling strategies. Verify the spike source and confirm it is not recurring. |
| High (> 50) | Low (< 30) | Early expansion signal. IV is rising rapidly from a prolonged low-vol base. IVP hasn’t caught up yet. | Investigate: is a catalyst driving the IVR spike? If IV is expanding structurally, avoid selling and monitor for IVP confirmation. |
When IVR and IVP diverge by more than 30 points, IVP is the more reliable signal. A large IVR-IVP gap is itself informative — it tells you the stock has experienced at least one extreme IV event in the trailing year that is distorting the IVR denominator. Check the stock’s IV history to confirm the source.
Adding the VRP Confirmation: The Triple-Filter Entry Rule
IVR and IVP compare current IV to its own past. They establish whether options are historically expensive, but not whether that price is justified. The IV vs. HV spread (the Volatility Risk Premium) adds this third dimension by comparing implied to realized volatility. For the complete VRP mechanics and why the premium persists structurally, see Implied vs. Historical Volatility §3.
The highest-conviction setup for premium selling:
IVR > 30 + IVP > 50 + IV exceeds HV by 5+ points
We accept a lower IVR threshold (>30 vs. >50) because IVP >50 already confirms frequency
robustness, overriding any spike distortion in the IVR reading. The positive IV–HV spread
confirms the VRP is structurally active — options are not just historically expensive but
demonstrably overpricing actual realized movement.
The Five-Step Screening Workflow
The two-stage filter and triple-confirmation rule combine into a repeatable pre-trade workflow:
- Step 1: IVR Quick Screen. Filter for IVR > 30 (selling candidates) or IVR < 20 (buying candidates). Discard remaining stocks at this stage.
- Step 2: IVP Confirmation. Apply the four-combination matrix. Stocks in the “Confirmed expensive” or “Spike Distortion / Trust IVP” quadrant proceed. Stocks in the “Early expansion” quadrant require additional monitoring.
- Step 3: VRP Confirmation. Verify IV exceeds HV20 by 5+ points. This confirms the Volatility Risk Premium edge is active and options are genuinely overpricing realized movement.
- Step 4: Catalyst Check. Confirm no earnings announcements, FDA decisions, FOMC, or binary macro events fall within the option’s life. Elevated IV from a known imminent catalyst is justified premium — not exploitable edge. For the earnings expected-move framework specifically, see Expected Move §7.
- Step 5: GEX Regime Check + Position Sizing. Cross-reference the GEX regime. Positive GEX (spot above ZGL) confirms dealer hedging will mechanically compress realized ranges, amplifying the VRP edge. Negative GEX requires size reduction regardless of IV metrics. Apply the 1–3% max-risk rule per trade.
Strategy Selection by IVP Level
| Strategy | Ideal IVP | Rationale |
|---|---|---|
| Credit Spread (bull put / bear call) | IVP > 50 | Rich premium; wider break-even distance; positive VRP edge for seller. |
| Iron Condor | IVP > 60, ideally > 70 | Maximum premium for range-bound thesis; widest expected move bounds reduce breach probability. For strike placement, see Strike Wall Analysis. |
| Covered Call / Cash-Secured Put | IVP > 50 | Higher premium yield on shares; superior cost-basis reduction per cycle. |
| Debit Spread (directional) | IVP < 30 | Cheap entry; minimal vega risk from IV crush; highest gamma per dollar spent. |
| Long Straddle / Strangle / LEAPS | IVP < 20 | Options at absolute historical cheapest; highest probability that realized vol will exceed implied over the holding period. |
| Calendar Spread | Short leg: IVP > 60 / Long leg: IVP < 40 | Exploits term structure differential; front-month IV crush benefits the position while back-month vol remains relatively low. |
Multi-Stock Screening: Reading the Signals Across Sectors
The workflow above applies differently across sectors because baseline IV levels vary structurally. Normalizing via IVR and IVP is what makes cross-sector screening consistent. The table below demonstrates the screening logic across five underlyings representing different volatility regimes:
| Stock | Current IV | IVR | IVP | HV20 | IV–HV | Signal & Notes |
|---|---|---|---|---|---|---|
| AAPL | 28% | 32% | 55% | 22% | +6% | Lean sell. IVP confirms moderate elevation. IVR is suppressed by an old earnings spike. Triple-filter: IVR>30 ✓, IVP>50 ✓, VRP +6 ✓. (Mega-cap typical range: 18–40%) |
| TSLA | 55% | 33% | 40% | 52% | +3% | Neutral. Both metrics are moderate; IV is near HV. VRP spread is thin (+3). No strong edge for either buyers or sellers — strategy should be driven by directional view. |
| NVDA | 42% | 33% | 72% | 30% | +12% | Classic spike distortion — trust IVP. IVR reads 33% (depressed by spike), IVP reads 72%. Triple-filter despite low IVR: IVR>30 ✓, IVP>50 ✓, VRP +12 ✓. Highly favorable for selling premium. |
| MRNA | 65% | 65% | 80% | 45% | +20% | Rich but sector-typical. Both metrics elevated; strong VRP. Biotech caution: check FDA calendar before selling — high IV may be justified by an imminent binary event. |
| XOM | 20% | 12% | 15% | 19% | +1% | Buy premium. Both metrics near 52-week lows. IV tracks HV closely (VRP near zero). Best for directional debit spreads or LEAPS if you have a thesis. |
The NVDA row is the most instructive example. A trader relying solely on IVR (33%) would classify options as near-cheap and potentially buy premium. The IVP (72%) and VRP spread (+12) reveal the true picture: options are genuinely expensive by frequency and relative to realized movement. This is precisely the scenario where IVR-only analysis leads to systematic strategy-selection errors.
Common IVR/IVP Mistakes
- Treating IVR and IVP as the same metric. They measure fundamentally different things (range position vs. observation frequency). After any volatility event, they will diverge. Always use both and apply the four-combination matrix.
- Using IVR in isolation for 6–9 months post-spike. A major earnings blowout or macro crash creates a 52-week high that systematically suppresses all subsequent IVR readings even when IV returns to genuinely elevated absolute levels. This is the single most common volatility-screening error.
- Selling premium at IVR < 20. IVR near its 52-week low means you are collecting minimum income for maximum obligation. This is the worst-risk-reward entry point for premium sellers and the best for buyers.
- Assuming IVR > 80 means “free money.” Extreme IVR is almost always driven by an imminent catalyst — earnings, FDA decision, macro event. The rich premium is fair compensation for genuine binary risk, not a structural VRP opportunity.
- Confusing platform terminology. Some platforms (Option Samurai) label their metric “IV Rank” when the underlying calculation is actually IV Percentile. Thinkorswim uses the standard IVR range-based formula. Always verify the calculation method before relying on any platform’s displayed value — a 72 reading means very different things depending on which formula produced it.
- Comparing IVR across different stocks. An IVR of 50 on AAPL (IV range 20–45%) and an IVR of 50 on GME (IV range 50–150%) describe completely different absolute premium levels. IVR is relative to each stock’s own history only. Cross-stock comparison using IVR is meaningless.
IVR and IVP in StrikeWatch EA
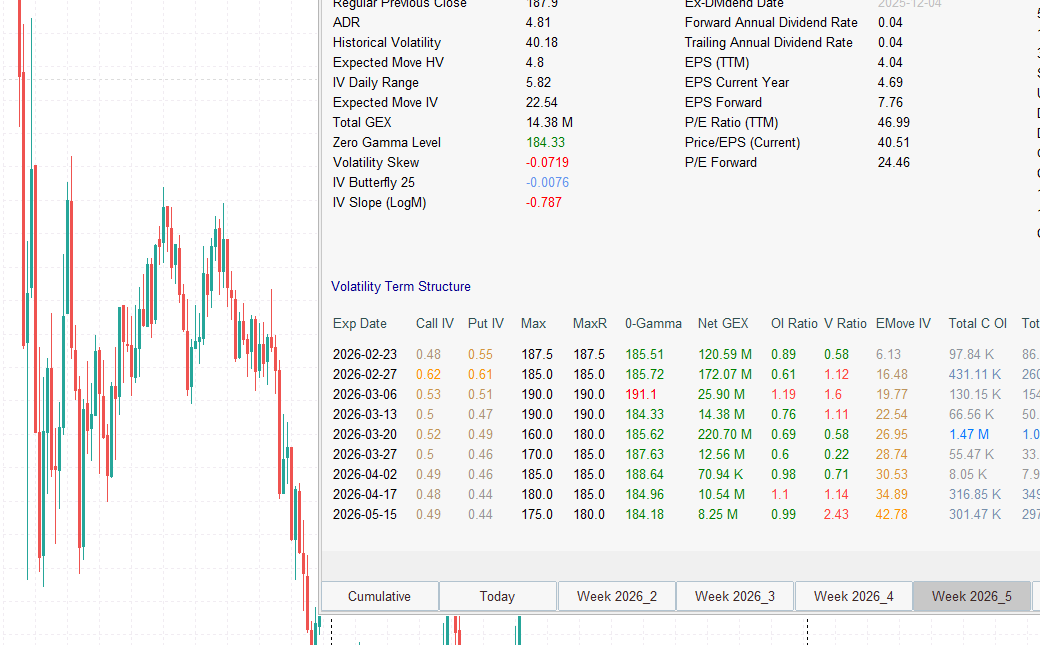
StrikeWatch EA’s Summary Surface module executes the full five-step screening workflow without leaving the MT5 terminal:
- IVR & IVP side by side with divergence flagging: When the two metrics diverge significantly (e.g., IVR < 30, IVP > 60), color-coding makes the discrepancy immediately visible — alerting you to apply the spike-distortion diagnostic before committing capital.
- Live IV–HV spread: The exact numerical VRP for instant triple-filter confirmation at Step 3 of the workflow.
For the complete description of all Summary Surface modules including the term structure heatmap and per-strike IV display, see Implied vs. Historical Volatility §9.

IVR uses 2 data points; IVP uses 252. After any spike, IVR is distorted
for 6–9 months. IVP correctly reflects the frequency distribution throughout.
The four-combination matrix resolves every divergence scenario. Low IVR +
High IVP = spike distortion, trust IVP. High IVR + Low IVP = early expansion, investigate
before selling.
The triple-filter entry rule is the systematic edge. IVR > 30 + IVP
> 50 + IV exceeds HV by 5+ points = all three dimensions confirm premium is genuinely
overpriced relative to both history and realized movement.
The five-step workflow adds catalyst and GEX context. IV metrics alone are
insufficient — a confirmed VRP edge can be neutralized by an imminent binary event or
a negative GEX regime. Steps 4 and 5 are not optional.
The NVDA scenario is the canonical example. IVR = 33% (looks cheap), IVP =
72%, VRP = +12 (clearly expensive). IVR-only analysis inverts the strategy direction
entirely.