Why Earnings Season Is Different
Earnings announcements create discrete jumps in information: a single report can reprice expectations for growth, margins and risk. Options markets respond by elevating implied volatility ahead of the event and then crushing it afterwards — a phenomenon known as IV crush, the sharp collapse in implied volatility once the uncertainty resolves.
For options traders, this means:
- Pre–earnings, options often trade with rich implied volatility and large implied moves.
- Post–earnings, implied volatility typically collapses and realized moves are either smaller, in line with, or larger than the implied move.
A robust earnings playbook therefore has three pillars: implied move analysis, volatility regime assessment, and structural positioning via OI, volume and Max Pain.
Estimating the Implied Move from Straddles
The simplest and most widely used way to estimate the market’s expected move for an earnings event is through the price of the near-term at-the-money (ATM) straddle:
- Pick the option expiry that captures the earnings event (often the first expiry after the report).
- Identify the strike closest to the current stock price.
- Add the call and put premiums; divide by the stock price to get a percentage move.
This is an approximation, but good enough for relative decisions: if your own view is that the stock will move dramatically more or less than this range, it informs whether you want to be long or short volatility into the event. For the complete formula, worked examples, and how to compare the straddle-derived EM against historical earnings moves, see Expected Move in Options →.
Using Summary Surface: IVR, IVP and IV vs HV Around Earnings
StrikeWatch’s Summary Surface shows where current implied volatility stands in its own history and relative to realized volatility. Around earnings, you care about:
- IVR/IVP into earnings: Elevated IVR (e.g. > 70) suggests the market is already charging a high premium for uncertainty.
- IV vs HV spread pre–event: If implied vol is far above historical realized vol for similar periods, options may be rich; if they are close or IV is below HV, options may be relatively cheap.
- Post–earnings IV behavior: Historical pattern of how quickly IV collapses after earnings in this name.
Combining implied move and IV metrics gives you a first–pass classification:
- Rich vol, implied move larger than typical realized: Short–Vega strategies favored.
- Cheap or moderate vol, implied move smaller than realized: Long–Vega strategies more attractive.
Short-Vol Strategies: Monetizing IV Crush
When the data show that average realized earnings moves are smaller than implied and IV consistently collapses after the event, short–Vega plays are natural. The mechanics of each structure — delta, theta, and vega profiles — are detailed in the Income Strategies guide. In the earnings context, here is when each applies:
| Strategy | Profile | When to Use |
|---|---|---|
| Short straddle | Maximal short Vega and theta around the ATM; high risk. | Experienced traders, very strong evidence that realized < implied. |
| Short strangle | Short OTM calls and puts; slightly lower Vega, wider profit zone. | Names with stable earnings reaction and no history of extreme gaps. |
| Iron condor | Defined-risk version of strangle, using long wings to cap losses. | Retail-friendly choice when you want to cap tail risk from outliers. |
In StrikeWatch, you can benchmark historical IV crush and realized moves for each ticker, then use current IVR and implied move to decide whether this earnings cycle looks typical or anomalous before selling volatility.
Long-Vol Strategies: When Earnings Outrun Expectations
Some stocks regularly make larger moves than the options market implies, especially during early growth phases or in highly speculative sectors. In these cases, strategies that are long Vega may be warranted. Full strategy mechanics are in Options Income & Volatility Strategies →.
- Long straddles: ATM call + ATM put; pure play on move magnitude, agnostic on direction.
- Long strangles: OTM call + OTM put; cheaper premium, requires larger move.
- Directional spreads: Debit call/put spreads when you have a directional bias and implied vol is not extremely expensive.
StrikeWatch helps by showing:
- How current implied move compares to past realized earnings moves.
- Whether IV is only modestly elevated (fertile ground for long vol) or already near panic levels.
- Where structural levels (GEX, Max Pain, volume floors) sit relative to your intended strikes.
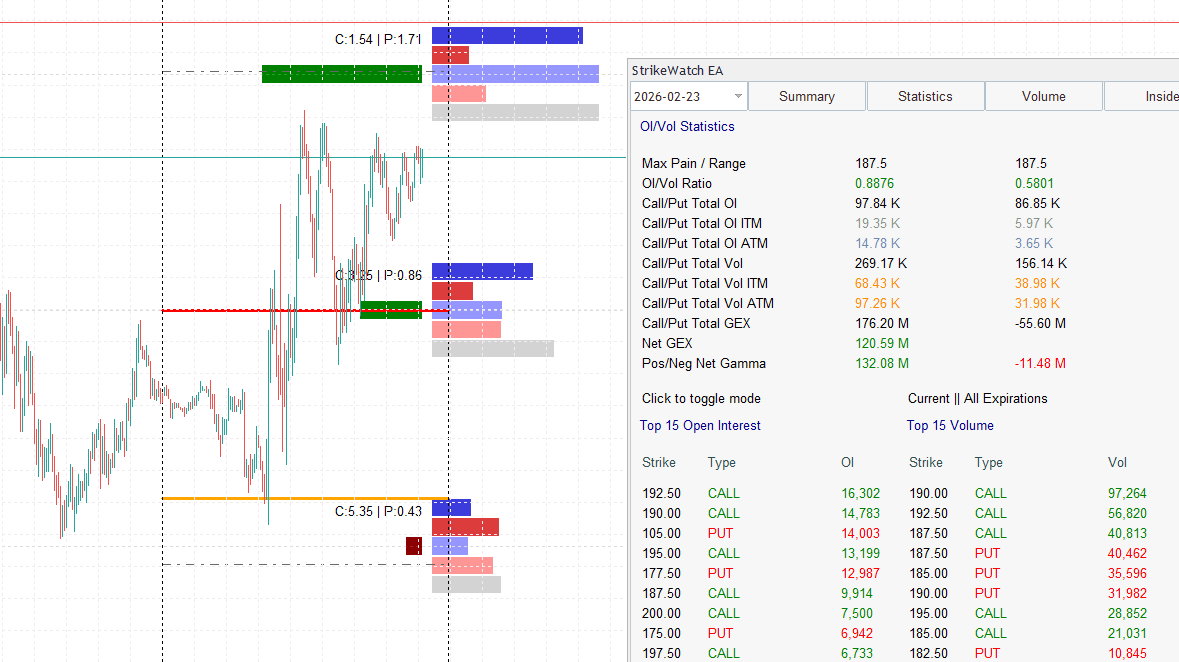
Interpreting OI & Volume Positioning Around Earnings
OI & Flows in StrikeWatch show where large traders are positioning ahead of earnings:
- Concentrated call OI above spot: May signal speculative upside bets or overwriting.
- Heavy put OI below spot: Can indicate hedging, speculative downside, or dealer short gamma exposure.
- Skew in volume: Sudden spikes in one side (puts or calls) near earnings can reveal last–minute institutional flows.
Combined with GEX dealer positioning, this tells you:
- Whether dealers are likely to be long or short gamma in the earnings window.
- Which strikes are potential gravity wells where price may gravitate or bounce.
Max Pain and Structural Pinning into and After Earnings
Max Pain is the theoretical price level at which options sellers would maximize P&L at expiration. Around earnings, it can act as:
- A potential pinning magnet when earnings coincide with OPEX, especially if GEX is positive above and below that strike.
- A reference point for choosing short strikes in iron condors or covered calls post–earnings.
In StrikeWatch, overlaying Max Pain with GEX and volume profiles lets you see whether the post–earnings tape is structurally more likely to revert toward certain levels or trend away from them.
Pre-Earnings, Event-Day and Post-Earnings Playbooks
Instead of a single “earnings strategy”, think in three phases:
- Pre-earnings: Volatility run–up; IVR and implied move rising. Good window for structural short–vol in names where historical realized moves are small vs implied — if your risk management supports it.
- Event-day: Gap open and intraday volatility. Often best handled with intraday 0DTE structures (iron condors/flies) rather than holding overnight risk through the print.
- Post-earnings drift: IV crush has happened; now focus on direction and mean reversion. Here, directional spreads and Wheel-style income (cash-secured puts or covered calls) against revised fundamentals can shine.
StrikeWatch supports all three phases: Summary and implied move pre–event, GEX/ZGL and 0DTE analytics during the event, and Volume/Max Pain/OI analytics for the post–earnings regime.
Portfolio and Risk Management Across Many Earnings Names
Trading many earnings at once can easily inflate tail risk. Portfolio–level guidelines (the full framework is in Options Risk Management →):
- Limit the number of simultaneous short–vol earnings trades, especially in correlated sectors.
- Cap total Vega and gamma exposure into major earnings days using portfolio Greeks analysis.
- Avoid selling large amounts of earnings premium when broader indices are near ZGL or in negative–GEX regimes; structural fragility magnifies gap risk.
Treat your earnings book as a portfolio of event bets, not a series of isolated trades.
Earnings Workflow in StrikeWatch EA
A StrikeWatch earnings workflow could look like this:
- Screen: Use Summary to identify tickers with upcoming earnings and elevated IVR/IVP.
- Measure: For each, compute implied move from the ATM straddle and compare to historical post–earnings moves and IV crush patterns.
- Diagnose structure: Inspect OI & Flows and GEX/ Max Pain to understand where big players are positioned and how dealers are likely hedged.
- Choose stance: Decide for each name: short vol, long vol, or no pre–event exposure; optionally plan post–earnings plays based on likely drift vs mean reversion.
- Execute and manage: Size trades modestly, diversify across names and sectors, and use defined–risk structures wherever possible.
Over time, this structure turns earnings from an anxiety–inducing lottery into a repeatable, data–driven part of your options playbook.
Earnings create a predictable volatility cycle in two acts: inflation then crush.
IV rises as uncertainty builds before the print, then collapses when the report resolves.
Every earnings strategy is either harvesting that collapse (short vol) or betting that the
actual move will outrun what the market already priced (long vol).
The ATM straddle is your scoreboard. Its price directly approximates the
market’s expected move for that earnings event. Compare this implied move to the
stock’s historical post-earnings moves across 4–8 prior quarters. If the market
is pricing significantly more than history justifies, sell the straddle. If history routinely
exceeds the implied price, buy it.
IVR and IVP are necessary context, not sufficient signals. A straddle that
appears “expensive” because IVR is 80 may still be cheap if this stock typically
moves 15% on earnings and the straddle prices only 8%. Always cross-reference the volatility
regime with the stock’s specific move history before classifying the earnings vol as
rich or cheap.
The iron condor is the retail default for earnings — for good reason.
Defined risk, short vol, and no overnight share exposure make it the structurally appropriate
choice when you want to monetize IV crush without the unlimited risk of a naked short straddle.
Place short strikes outside the 1-SD expected move; buy wings 2–3 strikes further out.
Event-day and post-event are different games. On the event day, the gap open
resolves most of the implied move instantly — 0DTE iron condors around the opening range
exploit what remains of the IV crush after the gap. Post-earnings, IV is already crushed; the
edge shifts entirely to direction and structural mean reversion using Max Pain and GEX as
gravitational guides.
Portfolio earnings risk compounds silently. Selling premium on five correlated
tech names in the same week is not diversification — it is five correlated positions
that can all gap adversely on the same macro shock. Cap simultaneous short-vol earnings
exposure by sector, and reduce size when broader indices are below the ZGL.