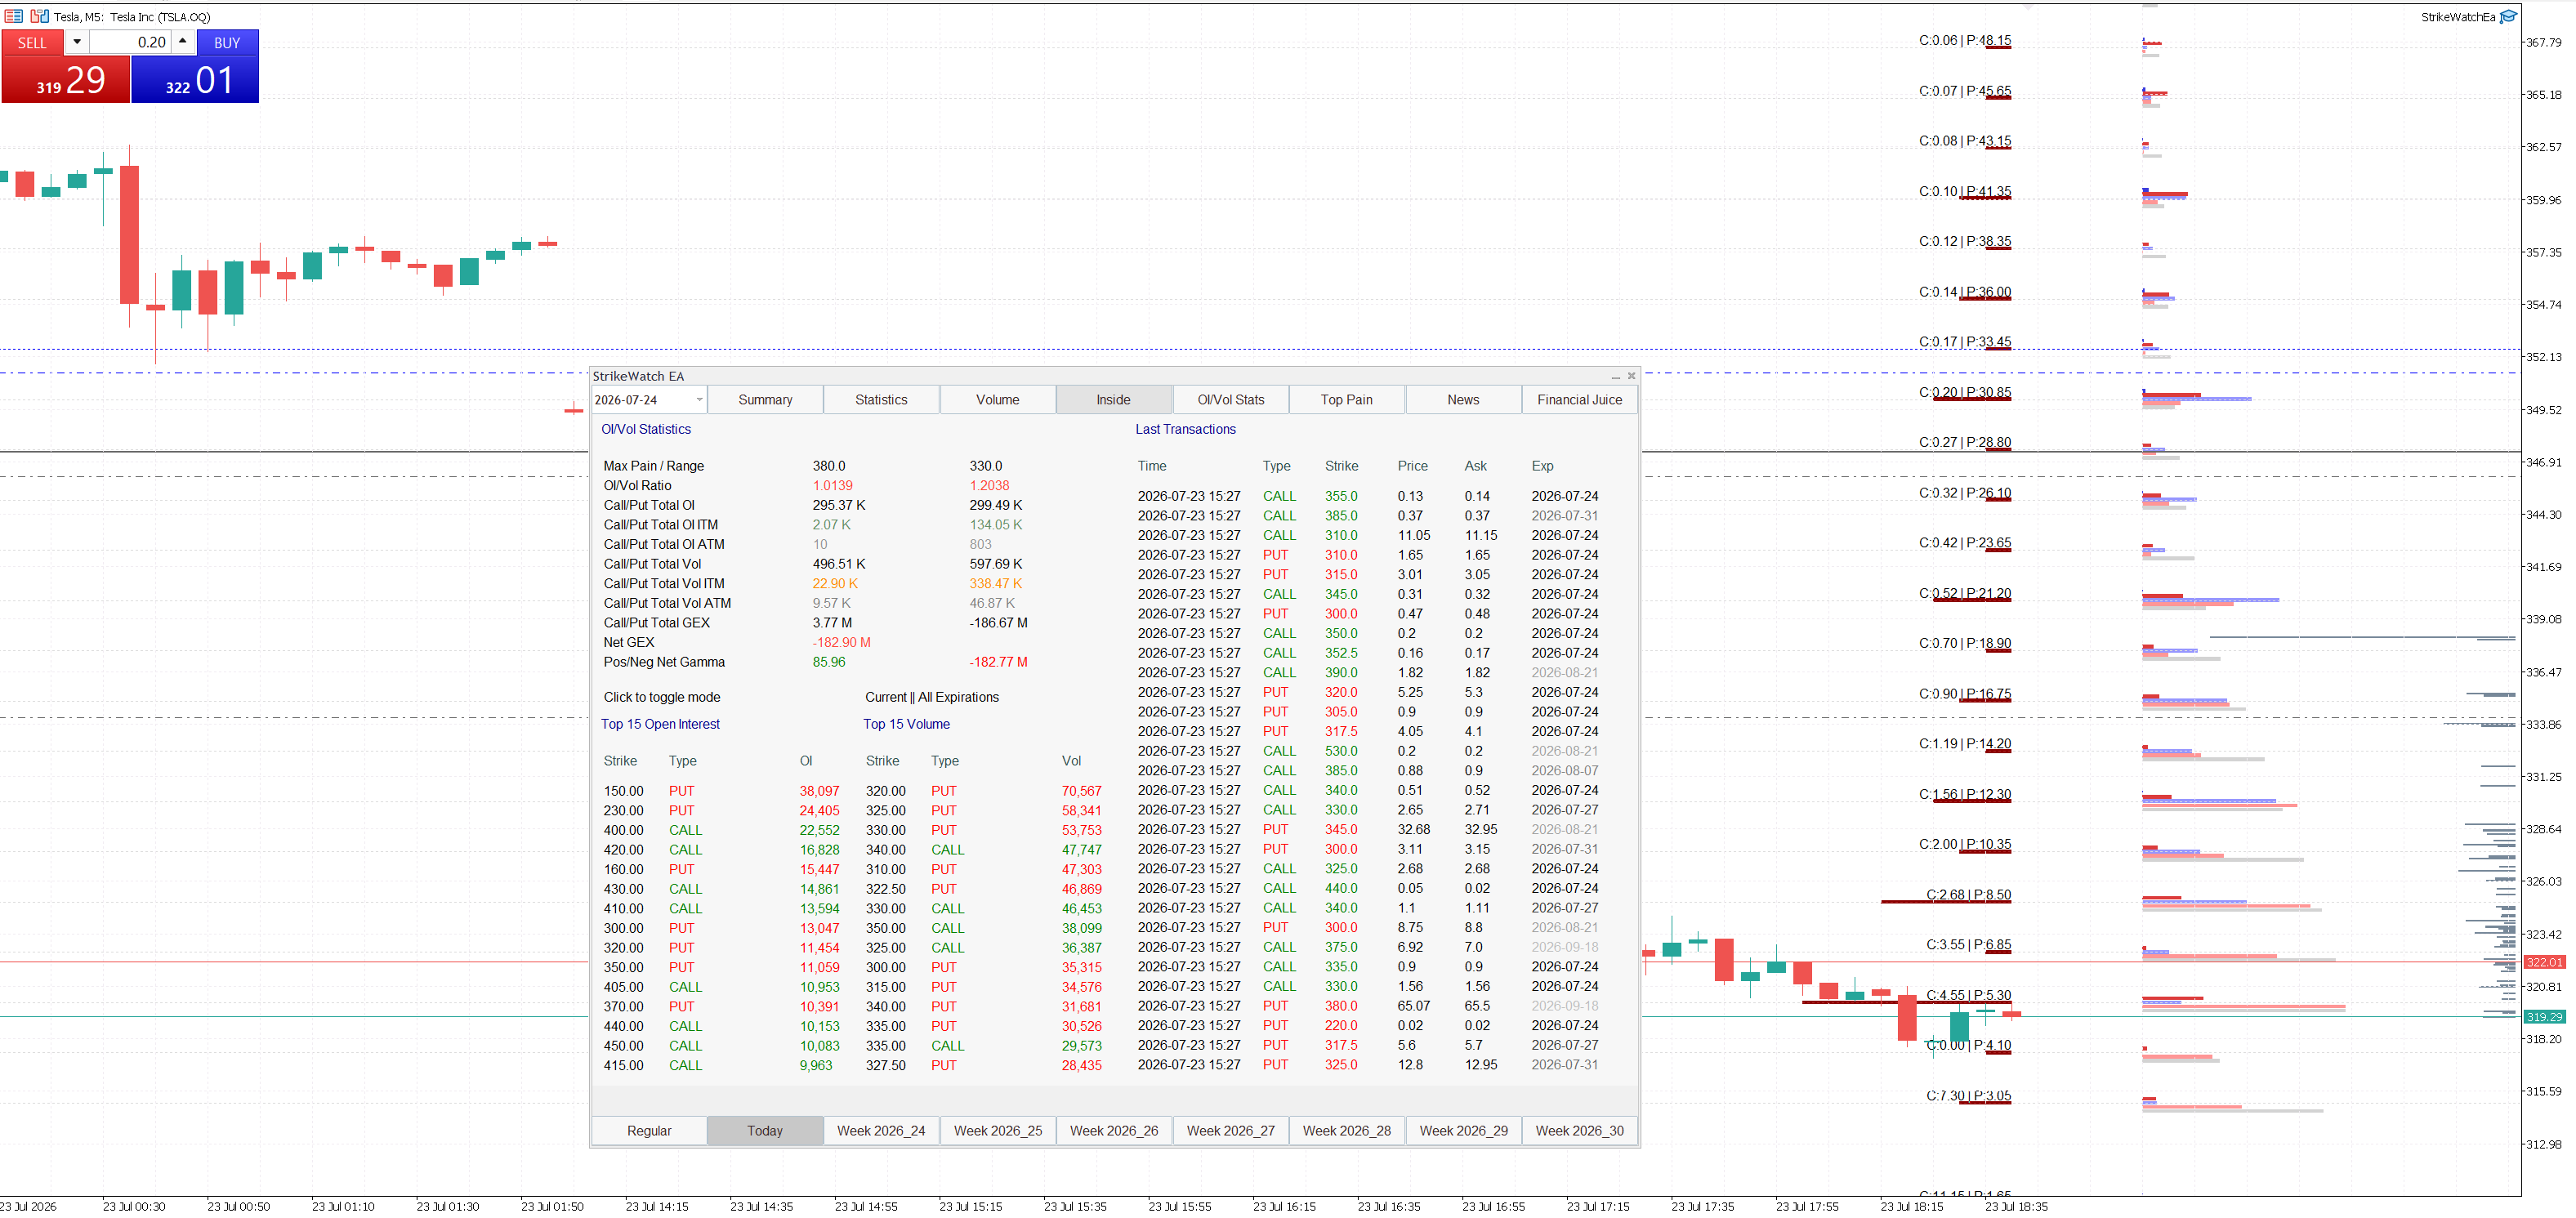
Analysis Status (Published July 25, 2026): This report covers four time segments: July 28, weekly OPEX July 31, the week of August 7, and the monthly OPEX August 21. Key levels to watch: ZGL $320.89 (Monday regime threshold), $300 (line in the sand), 52W Low $297.82. The update section will be filled in after each OPEX. Jump to live updates ↓
1. Market Context & Price Structure
Tesla (TSLA) closed Friday July 25, 2026 at $313.03, down -2.08% on the session with RVOL 1.28x and significant institutional participation. The price is 37.2% below its 52-week high ($498.83 from January 2026) and only 5.1% above the annual low ($297.82). Two sessions earlier — on July 22 — Q2 2026 earnings triggered a spike to $374.01 that was entirely sold back within 48 hours.
This is a textbook post-earnings bearish rejection structure: the market extended the AI and Robotaxi narrative one session of credit, then mechanically revoked it. The drop from $374 to $313 is not panic — it is the market repricing in response to fundamental disappointment at 295x P/E. Price now sits 22.2% below the MA50 ($402.56) and 24.5% below the MA200 ($414.71), locked in a confirmed structural downtrend with a series of lower highs since March 2026.
2. Fundamentals: The Narrative Trap at 295x P/E
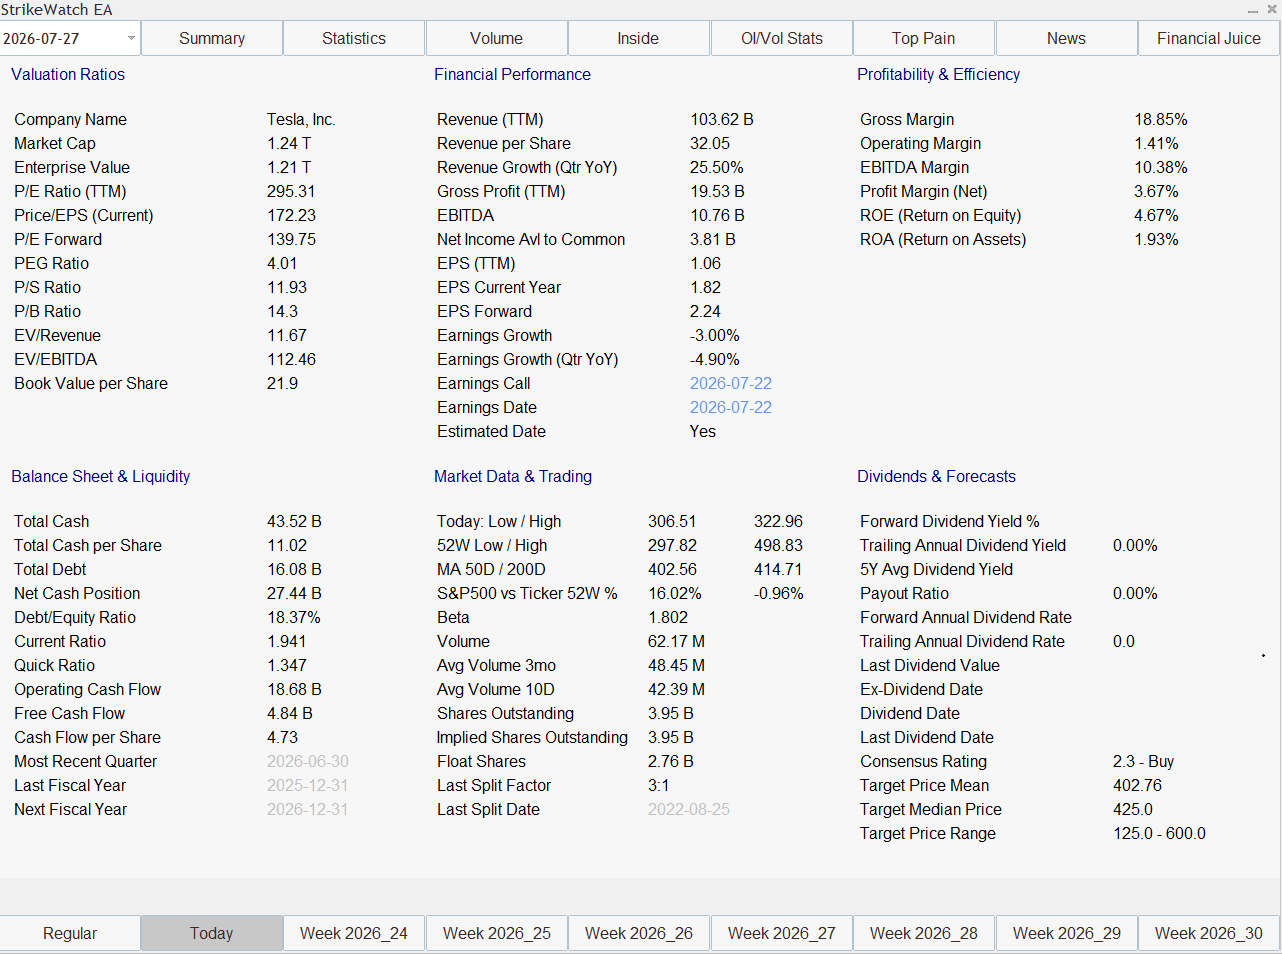
Before we get to options structure, we need to answer one question: why does the market price TSLA at 295x earnings in the first place? The answer is inevitably narrative-driven — Robotaxi, FSD Level 4, the Optimus robot, battery market dominance. But every narrative carries a price, and that price is the source of structural fragility.
TTM Revenue stands at $103.62B with YoY growth of 25.5% — that is genuinely good. The problem lies in the margins: an operating margin of 1.41% means that for every $100 of revenue, $1.41 in operating profit remains, while gross margin at 18.85% tracks below the historical norm of 20%+. QoQ earnings growth is -4.9%. A company with this cost profile might justify a P/E of 40–50x under an optimistic margin recovery story — not 295x.
| Metric | TSLA Value | Interpretation |
|---|---|---|
| P/E TTM | 295.31x | Growth valuation — requires flawless execution for years |
| P/E Forward | 139.75x | Implies EPS growth from $1.06 to $2.24 — +111% in 12 months |
| PEG Ratio | 4.01 | Value >2 = overvalued even at high growth rates |
| Operating Margin | 1.41% | Critically thin for a stock trading at 295x P/E |
| Earnings Growth QoQ | -4.90% | Negative — the trend is moving in the wrong direction |
| Net Cash | +$27.44B | Strong balance sheet — rules out a bankruptcy scenario |
| FCF | $4.84B | Positive — the company is generating cash |
| Analyst Target (Median) | $425 | +35.8% upside — but range $125–$600 = extreme lack of consensus |
The one clear positive is the strong balance sheet: Net Cash $27.44B, FCF $4.84B, Debt/Equity only 18.37%. Tesla will not go bankrupt — this eliminates the tail risk. But a strong balance sheet does not justify 295x P/E. The post-earnings spike to $374 = the market briefly believed the narrative; the selloff to $313 in two sessions = the market quickly discounted it.
3. Gamma Regime: The Environment That Amplifies Every Move
Fundamentals explain why price is under pressure. Options structure explains how quickly and aggressively that pressure can materialize. Net GEX (Gamma Exposure) describes the positioning of options dealers relative to the market — positive GEX stabilizes prices, negative GEX amplifies every move.
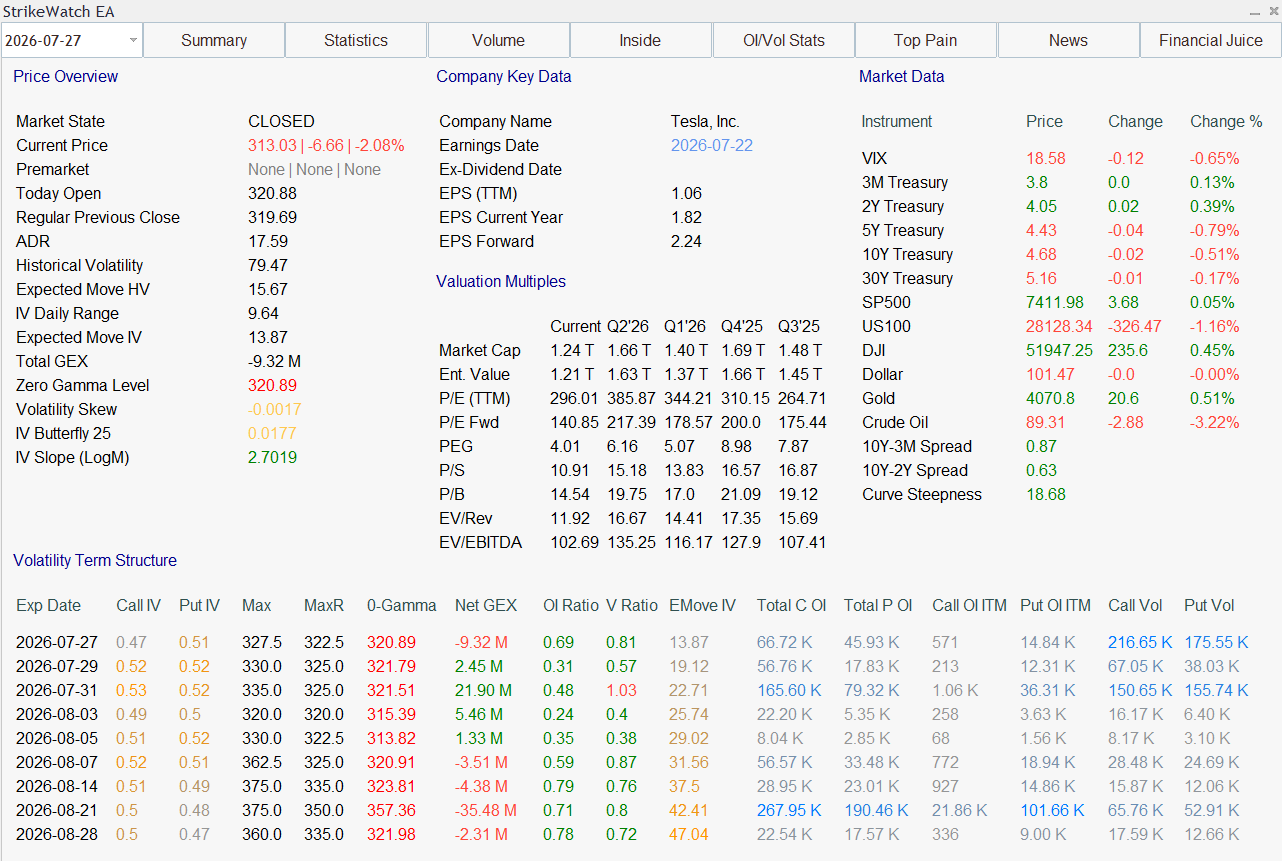
The current Net GEX for the 07-27 expiry is -$9.32M — a negative regime. But that is not the biggest problem. The August OPEX (August 21) carries a Net GEX of -$35.48M with a negative-to-positive gamma ratio of 8.61:1 (Neg: -$46.57M vs Pos: +$5.41M). This is the most extreme negative regime across the entire analyzed expiry universe. Throughout August, dealers will function as accelerators of every downside move.
| Expiry | Net GEX | Regime | ZGL (Zero Gamma Level) | Max Pain |
|---|---|---|---|---|
| 07-27 (expired) | -$9.32M | Negative | $320.89 | $327.50 |
| 07-29 | +$2.45M | Weakly positive | — | — |
| 07-31 (weekly OPEX) | +$21.90M | Strongly positive | $321.51 | $335.00 |
| 08-07 | -$3.51M | Negative | $320.91 | $362.50 |
| 08-21 (monthly OPEX) | -$35.48M | Strongly negative | $357.36 | $375.00 |
The key takeaway from this table is the August ZGL: $357.36. This means price must rally +14.2% from $313 to shift the regime from amplifying to stabilizing. Given the current downtrend and fundamentals, that is a minority scenario. The only window of positive GEX across the entire analyzed horizon is the 07-31 expiry (+$21.90M) — and it is precisely this window that defines the short-term bounce opportunity.
4. Segment 1: Monday July 28 — Testing the Regime Threshold
The market opens Monday with price at $313.03, 2.51% below ZGL $320.89. Friday's session (RVOL 1.28x, "High Participation" with no clear directional resolution) signals that large money has not yet committed — it was a session of observation, not decision. The expiration of 07-27 removes its negative GEX (-$9.32M) from the system, but does not change the dominant technical context.
A critical observation from Friday's options volume: at the $310 strike, PUT vol was 36,797 + CALL vol 29,851 — over 66 thousand contracts at a single strike for the 07-27 expiry. This "gamma battle" at $310 anchored price throughout Friday's session. On Monday that tension disappears — and the market enters an open battlefield between three scenarios.
| Scenario | Probability | Target | Trigger Condition |
|---|---|---|---|
| A — Continuation of decline | 45% | $305–$308 | Break of $310 on volume; no pre-market catalyst |
| B — Technical bounce to ZGL | 35% | $320–$321 | Short covering after -16.3% in 2 sessions; 1-SD Expected Move $299–$327 |
| C — Range / Pin | 20% | $305–$320 | No catalyst; gamma battle at $310 migrates to 07-31 |
A Monday close above $321 would be the first technical buy signal in weeks — simultaneous recapture of ZGL for both 07-27 and 07-31. A close below $308 raises the probability of a $300 test before Thursday's OPEX.
5. Segment 2: Tuesday–Thursday (07-31 OPEX) — The Only Stabilization Window
The 07-31 expiry is the only one across the entire analyzed universe with positive Net GEX (+$21.90M). This is not coincidence — it is the options structure signaling that this window structurally favors stabilization. As 07-27 and 07-29 expire, their negative exposure leaves the system. From Wednesday onward the market operates under 07-31 dominance with a Pos/Neg Gamma ratio of +$44.21M / -$23.23M — the call side is 1.90x stronger than the put side.
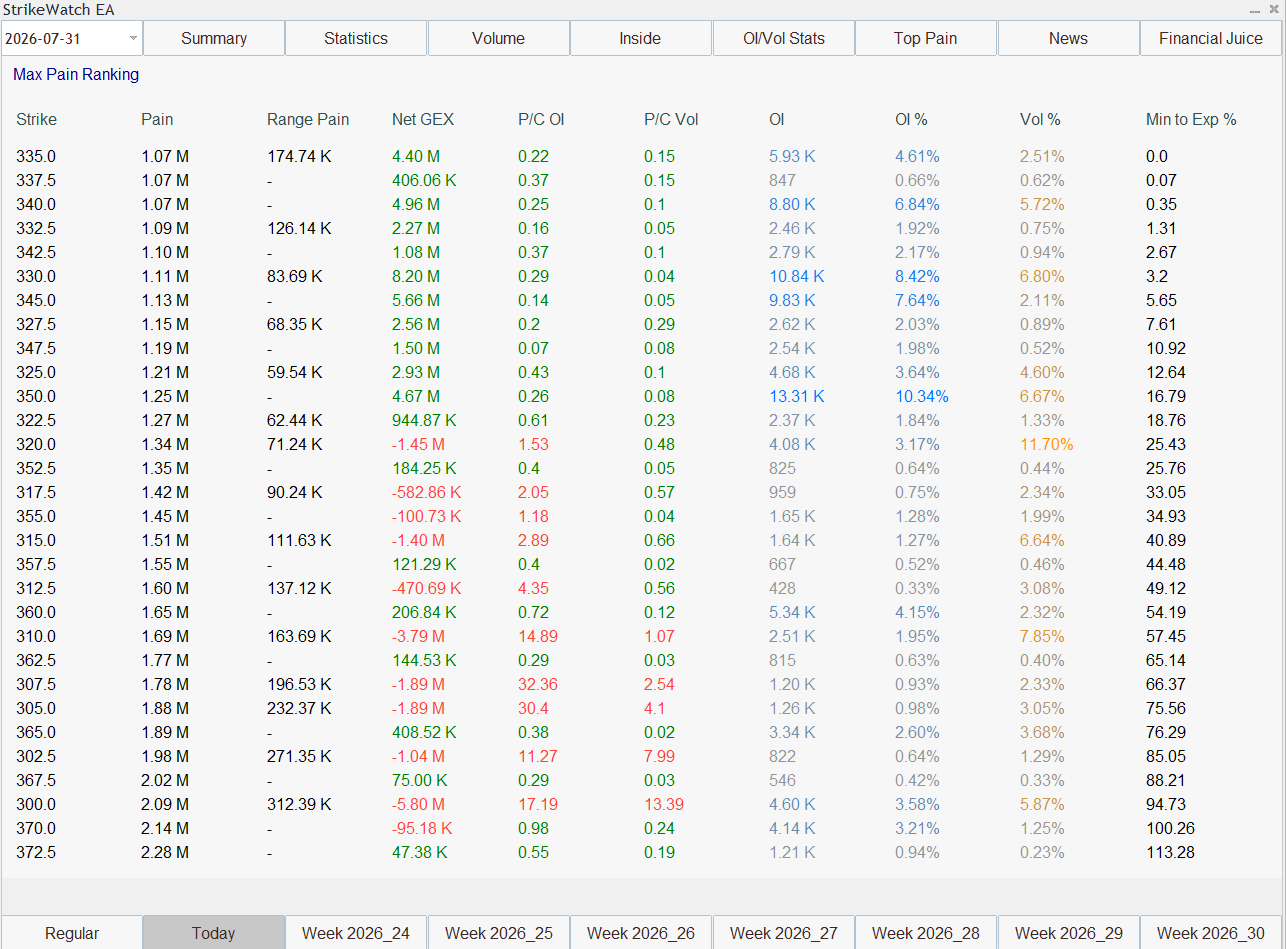
Max Pain for 07-31 is $335.00. The pain curve is asymmetric to the downside: at $335 Pain = $1.07M, at $310 Pain = $1.69M, at $300 Pain = $2.09M. Every closing point below $335 costs options buyers disproportionately more — creating a weak but real gravitational pull upward. Weak, because $22 is a lot to cover in three days. Real, because call-side GEX (+$44.21M) actively assists the move.
| Strike | Type | Open Interest | GEX | Structural Role |
|---|---|---|---|---|
| $350 | CALL | 13,310 (10.34%) | +$4.67M | Primary weekly call wall — bounce ceiling |
| $345 | CALL | 9,830 (7.64%) | — | Intermediate resistance |
| $335 | — | — | +$4.40M | Max Pain — weekly target |
| $330 | CALL | 10,840 (8.42%) | +$8.20M | First call wall — strong resistance |
| $321.51 | — | — | 0 | ZGL 07-31 — regime-change threshold |
| $305 | PUT | — | — | PCR 30.4 — heavy put defense |
| $300 | PUT | 4,349 | -$5.80M | PCR 17.19 — systemic line in the sand |
Targets for Thursday July 31 close: Bull scenario (35% probability): $335 (+7.0% from $313), Max Pain gravity via call-side GEX. Base scenario (30%): $321 (+2.5%), ZGL recapture without breaking call wall $330. Bear scenario (25%): $300 (-4.2%), failure to recapture ZGL with continued pressure. Extreme bear (10%): $295 (-5.8%), delta-hedging cascade following a $300 breach.
6. Institutional ITM Puts: $376 Million Bet on Further Decline
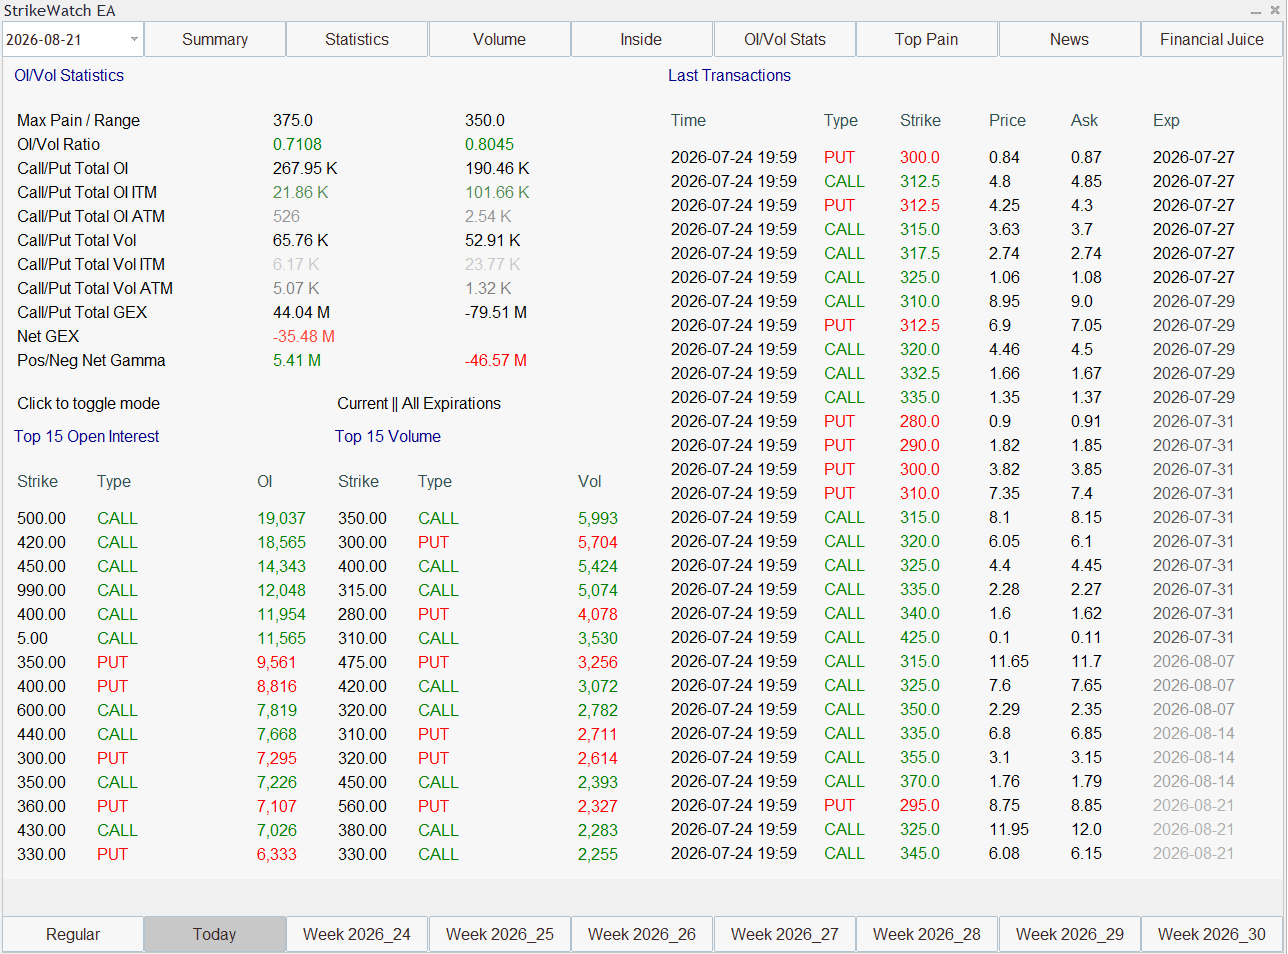
The August 21 monthly OPEX dominates the entire map by scale of OI and extremity of GEX, with cumulative OI of 267,950 calls + 190,460 puts — more than double the 07-31 chain. But this scale carries one very specific signal. PUT OI ITM on 08-21: 101,660 contracts deeply in-the-money, versus CALL OI ITM: 21,860. A ratio of 4.65:1 in favor of the put side.
At an average ITM put strike of ~$350 and a delta of ~0.70, each contract provides 70 synthetic short shares. 101,660 × 70 = 7.1 million synthetic short shares from August ITM puts alone. This is not retail hedging — it is an institutional position with a notional value of approximately $376 million.
Two interpretations: (A) Hedging — large funds long TSLA purchase ITM puts as full portfolio protection, expecting a recovery; these puts expire worthless and the funds profit on shares. (B) Speculative — a directional bet on further decline, where every dollar lower generates profit on the position. Given the -37.2% trend from the peak, earnings growth -4.9%, and operating margin 1.41%, the speculative interpretation is structurally more credible. Institutions do not buy 101K ITM puts "just in case."
7. August 2026: Monthly OPEX Structure and Targets
The August 21 monthly OPEX dominates the entire map through scale of OI and the extremity of its GEX. Net GEX -$35.48M with a Neg/Pos Gamma ratio of 8.61:1 means that the move-amplifying regime will persist uninterrupted throughout August — with the sole exception of the 07-31 window. The August ZGL at $357.36 is far away: a +14.2% rally from $313 is required to reach it.
The dominant strike walls in the August chain: the largest CALL OI is at $420 with 23,510 contracts (10.51% of total OI) — the institutional ceiling. Next walls are $400 (20,770 contracts, active trading, vol 10.15%), $500 (19,037 contracts, distant) and $450 (14,343 contracts). All call walls are more than 27% above current price, signaling an absence of nearby structural resistance — the market does not expect price to trade in that zone.
| Strike | OI | % Total OI | Structural Role |
|---|---|---|---|
| $420 CALL | 23,510 | 10.51% | Largest OI — institutional August ceiling |
| $400 CALL | 20,770 | 9.29% | Active trading, vol 10.15% — intermediate call wall |
| $500 CALL | 19,037 | — | Long-term bull target — "lottery tickets" |
| $375 | — | — | August Max Pain — gravitational target on a bounce |
| $357.36 | — | — | August ZGL — regime-change threshold for the month |
| $350 CALL | 16,790 | 7.51% | Active zone — August structural floor on a bounce |
| $270 PUT | 7,892 | — | Put wall below $300 — next stop in a cascade scenario |
August 21 OPEX targets: Bull scenario (20%): $375 (+19.8%), Max Pain gravity — requires ZGL $357 recapture and a new catalyst. Base scenario (35%): $330 (+5.4%), consolidation below ZGL with no fresh impulse. Bear scenario (35%): $270 (-13.7%), downtrend continuation amplified by Net GEX -$35.48M. Extreme scenario (10%): $250 (-20.1%), breach of 52W Low triggering institutional stop-loss cascade.
8. Level Map & Macro Context
Historical Volatility (HV) for TSLA stands at 79.47 — the 99th percentile of realized volatility. The Expected Move based on IV ($13.87) is 11.5% lower than the Expected Move based on HV ($15.67), meaning implied volatility is cheap relative to what the market is actually delivering. IV Slope (LogM) of 2.7019 signals a steep term structure — longer-dated options are pricing significantly higher uncertainty than near-term ones.
The macro context does not explain the pressure on TSLA: VIX 18.58 (-0.65%) signals a normal environment with no systemic panic, the S&P500 closed Friday +0.05%, and the yield curve (10Y-2Y spread +0.63%) is normal and pro-growth. The tech rotation (US100 -1.16%) partially aligns with the pressure, but Crude Oil at $89.31 (-3.22%) provides a mild headwind for the EV narrative — cheap oil reduces the economic urgency of the shift from combustion engines. This is a company-specific story, not a macroeconomic catastrophe.
| Level | Role | Rationale |
|---|---|---|
| $374 | Psychological resistance | Earnings high July 22 — peak rejected by the market |
| $357.36 | August ZGL | Regime-change threshold — shift from amplification to stabilization |
| $335 | Max Pain 07-31 | Weekly target in the bull scenario |
| $330 | Call Wall 07-31 | GEX +$8.20M, OI 10,840 — first resistance wall |
| $320–321 | ZGL cluster | ZGL 07-27 and 07-31 — critical weekly threshold |
| $313.03 | CURRENT PRICE | — |
| $310 | Gamma battle zone | PUT vol 36K + CALL vol 29K — immediate contest zone |
| $300 | Line in the sand | PCR 17.19, Pain $2.09M — systemic risk threshold |
| $297.82 | 52W Low | Absolute annual support — breach = new low |
| $270 | PUT Wall 07-27 | OI 7,892 — next stop after a $300 breach |
9. Trading Plan: Exact Entry, Stop-Loss & Exit Levels
The following is a concrete position-by-position breakdown synthesized from every level identified in this report — entry zones, invalidation levels, and profit targets tied directly to the ZGL, Max Pain, and OI structure discussed above.
Position 1 — Primary Short (Active Now)
| Direction | SHORT (puts or CFD short) |
| Entry | $313–$321 — any bounce toward ZGL $320.89 improves entry |
| Stop-Loss | Close above $322 on volume >1.5x RVOL (ZGL recapture invalidates thesis) |
| Target 1 | $300 (-4.2%) — line in the sand, PCR 17.19 |
| Target 2 | $270 (-13.7%) — put wall after $300 breach |
| Exit Rule | At Target 1: close 50%, move SL to breakeven. At Target 2: close remainder. If $300 holds 2 sessions without breach: exit remaining position. |
Position 2 — Short-Term Bounce (July 28–31 Window Only)
| Direction | LONG (calls or CFD long) |
| Entry Condition | Close above $321.51 on volume >1.5x RVOL (Mon/Tue). No entry if condition unmet. |
| Stop-Loss | Close back below $318 the following session |
| Target 1 | $330 (+2.7%) — call wall, GEX +$8.20M |
| Target 2 | $335 (+4.3%) — Max Pain 07-31 OPEX |
| Hard Deadline | Exit fully by close Thursday July 31 — positive GEX window ends at OPEX regardless of price |
Position 3 — Short Resumption (Post 07-31 OPEX)
| Direction | SHORT |
| Entry | After July 31 close, if price is below $321. If price is above $321, wait for a retrace below ZGL before entering. |
| Stop-Loss | Close above $357.36 — August ZGL, regime change for the entire month |
| Target 1 | $300 |
| Target 2 | $270 |
| Duration | Through August 21 OPEX or until target reached |
Position Summary
| Position | Direction | Entry | Stop-Loss | Target 1 | Target 2 | Deadline |
|---|---|---|---|---|---|---|
| 1 — Primary Short | SHORT | $313–$321 | $322+ | $300 | $270 | No limit |
| 2 — OPEX Bounce | LONG | >$321.51 on vol | $318 | $330 | $335 | Jul 31 EOD |
| 3 — Post-OPEX Short | SHORT | <$321 after 07-31 | $357.36 | $300 | $270 | Aug 21 |
Disclaimer: This is not financial advice. Position sizing, entries, and exits shown here are for illustrative purposes based on options structure and technical levels discussed in this report. Every investment decision requires independent due diligence and risk management appropriate to your own account.
10. Scenarios & Live Updates
This section will be updated after each key expiry. Below is the baseline scenario at time of publication, with space reserved for updates after the July 31 OPEX, the August 7 week, and the August 21 monthly OPEX.
Baseline Scenario — July 25, 2026 (Publication)
At time of publication the central thesis is: TSLA is caught in a structural trap between fundamental overvaluation and a negative gamma environment. Price at $313 sits 5.1% above the annual low, inside a negative regime, with 101K ITM puts loaded institutionally for August.
The only technical bounce window within a 4-week horizon is the 07-31 expiry (Net GEX +$21.90M). Bullish activation condition: a close above ZGL $321.51 on volume >1.5x RVOL by Wednesday July 29. Invalidation condition: breach of $300 on volume >2x RVOL — triggers a cascade toward $270.
The August 21 monthly OPEX structurally favors continued pressure (Net GEX -$35.48M, ZGL $357.36 unreachable without a new catalyst). The thesis will be revised upon: (A) August regime change — price above $357 on volume, or (B) a new fundamental catalyst (Robotaxi/FSD commercial launch breakthrough, guidance revision, large institutional deal).
Update: July 31, 2026 — Weekly OPEX (pending)
Update will be added after the close of the July 31, 2026 session.
Update: August 7, 2026 — Post-OPEX Week (pending)
Update will be added after the close of the August 7, 2026 session.
Update: August 21, 2026 — Monthly OPEX (pending)
Update will be added after the close of the August 21, 2026 session.
11. Risk & Thesis Invalidation Conditions
No scenario is immune to an unexpected catalyst. The absolute invalidation of the bearish thesis is a close above $357.36 (August ZGL) on volume >2x RVOL. Such a move would shift the August regime from -$35.48M to a stabilizing environment and open the path toward Max Pain $375.
Factors that could trigger the bullish scenario: (1) a breakthrough announcement for the full commercial launch of Robotaxi with regulatory approval, (2) a material guidance revision by management implying a return of operating margin above 8–10%, (3) a large share buyback program deploying the $27.44B cash position, (4) a positive macro surprise (Fed rate cut) driving the entire tech sector sharply higher.
Factors deepening the bearish scenario: (1) a close below 52W Low $297.82 — a technical signal triggering institutional stop-losses, (2) further operating margin erosion in Q3 2026, (3) escalating price competition in the EV market (BYD, Rivian, GM EV) forcing additional price cuts, (4) a systemic rotation out of tech as 10Y yields exceed 5% and the yield curve inverts.
12. Indicator Glossary: What the Numbers in This Report Mean
Below we explain every indicator used in this analysis — both its definition and how to interpret it in practice. This section is for readers who want to understand the mechanics, not just read the numbers.
Net GEX (Net Gamma Exposure)
What it is: The aggregate gamma exposure of all options dealers (market makers) on a given asset for a specific expiry. Expressed in dollars — it states how many dollars of delta must be hedged by dealers for every 1% move in price.
How it works: With positive Net GEX, dealers are "long gamma" — they buy dips and sell rallies (hedging counter to price movement). This stabilizes price and creates a mean-reversion effect. With negative Net GEX, dealers are "short gamma" — they sell dips and buy rallies. This amplifies every move in the dominant direction. In this report: Net GEX -$35.48M for August = dealers acting as accelerators of downside moves throughout the month.
ZGL — Zero Gamma Level
What it is: The price level at which the aggregate gamma exposure of dealers crosses through zero — transitioning from negative to positive or vice versa. It is the threshold for a market regime change.
How it works: Below ZGL — negative regime (move amplification). Above ZGL — positive regime (stabilization). The ZGL acts as a "Maginot Line" for options structure: crossing this level on volume is a signal of a change in market character, not merely a price move. In this report: Weekly ZGL cluster $320.89–$321.51 = the critical Monday threshold. August ZGL $357.36 = the regime-change threshold for the entire month.
Max Pain
What it is: The price level at which the aggregate value of expiring options (calls + puts) is minimized for options buyers — and therefore represents maximum loss for buyers and maximum gain for sellers (market makers). Calculated as the sum of intrinsic value of all ITM options at a given closing price.
How it works: The market tends to gravitate toward Max Pain in the final hours of an OPEX session, because market makers (options sellers) are financially incentivized to pin price in that area. The gravitational force is proportional to OI on the expiry — weak with small OI, meaningful with 550K OI as on 07-31. In this report: Max Pain 07-31 = $335 (weekly bull target), Max Pain 08-21 = $375 (August bull target on a regime change).
PCR — Put-Call Ratio
What it is: The ratio of put volume or open interest to call volume or open interest at a given strike or across an entire expiry. PCR > 1 = more puts than calls. PCR < 1 = more calls than puts.
How it works: An extremely high PCR at a specific strike (e.g. 17.19 at $300) signals massive institutional hedging or a directional bet on further decline. This creates a "put wall" — a density of options that generates intense delta hedging near that level. Breaching a put wall on volume triggers a cascade. Market maker defense is rapid but conditional. In this report: PCR 17.19 at $300 = a systemic risk anomaly; PCR 30.4 at $305 = institutional defense five dollars ahead of the line in the sand.
Positive/Negative GEX (Pos/Neg Gamma)
What it is: The distribution of gamma exposure into a stabilizing side (positive delta hedging) and an amplifying side (negative delta hedging). The Pos/Neg ratio states how many times stronger one side is relative to the other.
How it works: The higher the Neg/Pos ratio, the more pro-cyclical dealer behavior becomes. A ratio of 8.61:1 (August) means negative gamma is dominant to a degree where even a small downside move will be mechanically reinforced by dealer hedging. In this report: Ratio 8.61:1 is a number indicating extreme structural fragility.
OI (Open Interest)
What it is: The number of open options contracts at a given strike and expiry that have not yet been closed or settled. OI increases when new positions are opened and decreases when they are closed or expire.
How it works: High OI at a specific strike signals institutional position concentration — these are the "strike walls." The market tends to interact with these levels: call walls act as magnets during rallies (dealers hedge rising delta by buying shares), put walls as support during declines. OI% (as a share of total OI) helps contextualize — OI 23,510 at the $420 Call representing 10.51% of total is an extreme concentration. In this report: $420 Call with OI 23,510 (10.51%) = the institutional August ceiling.
ITM OI (In-The-Money Open Interest)
What it is: Open interest in options whose strike is "in the money" — options that would have intrinsic value if they expired right now. ITM Call = strike below current market price. ITM Put = strike above current market price.
How it works: Massive ITM Put OI at a price of e.g. $313, with strikes at $350–$400, represents positions already "in profit" — every further dollar lower generates $100 in profit per ITM put (100 shares per contract). This is a directional indicator of institutional intent, not hedging. An ITM Put/Call ratio of 4.65:1 means 4.65x more institutional capital is positioned for downside than for upside. In this report: 101,660 August ITM Puts = $376M notional in directional short positions.
Expected Move (IV vs HV)
What it is: The expected one-standard-deviation price move to expiration, calculated two ways: EM(IV) is based on implied volatility from options prices, EM(HV) is based on historical realized volatility of the stock.
How it works: When EM(IV) < EM(HV), options are "cheap" — the market is paying less for protection than actual volatility warrants. This favors options buyers (long vega). When EM(IV) > EM(HV), options are "expensive" — favoring sellers. In this report: EM(IV) $13.87 vs EM(HV) $15.67 = IV is 11.5% cheaper than realized volatility. August TSLA options are structurally underpriced.
HV (Historical Volatility)
What it is: The realized volatility of a stock's price, measured as the annualized standard deviation of daily log returns. It expresses how much the price has actually moved in the past.
How it works: HV 79.47 for TSLA means the price has moved with ~79% annualized volatility. This translates to an expected daily move of ~$15.65 (79.47% ÷ √252 × $313). HV 79.47 is the 99th percentile of TSLA's historical volatility — the market is operating in an extremely active environment. In this report: With HV 79.47 and IV Daily Range $9.64 — every session can deliver a 3%+ move, which in a -37% trend amplifies every directional signal.
IV Slope (LogM)
What it is: The slope of the implied volatility curve along the time axis (term structure). Measured on a log-moneyness scale. Positive IV Slope = longer-dated options more expensive than near-term ones (volatility contango).
How it works: IV Slope 2.7019 signals a steep term structure — the market prices long-term uncertainty significantly higher than near-term. This indirectly says: "we don't know what will happen in 2–3 months, but today's risk is moderate." Steep term structure is typical in post-earnings environments where short-dated IV has collapsed while long-dated IV remains elevated. In this report: Confirms that August options are relatively more expensive than weeklies — yet still cheaper than realized HV.
Volatility Skew
What it is: The difference between implied volatility of OTM puts vs OTM calls at the same delta (typically 25-delta). Negative skew = puts more expensive than calls (normal for equities — the market fears declines). Zero skew = symmetric pricing.
How it works: A strongly negative skew signals market fear of a sharp decline and a "tail risk" premium embedded in puts. A flat skew (-0.0017 for TSLA) is an anomaly — equities in a downtrend normally carry a strongly negative skew. This suggests either the market does not fear further decline (bullish read), or puts are so heavily represented in OI that the vol skew is "neutralized." In this report: Flat skew alongside 101K ITM puts = the market is balanced in its expectations — no extreme fear, but no optimism either.
P/E Ratio (Price-to-Earnings)
What it is: The ratio of the stock price to earnings per share (EPS). P/E TTM is based on trailing 12-month earnings; P/E Forward is based on projected EPS over the next 12 months.
How it works: A P/E of 295x means investors are paying $295 for every $1 of annual earnings. By comparison — the S&P500 trades at an average P/E of ~22x, Apple at ~30x. A P/E of 295x is justified only if the company's earnings grow exponentially for a decade. With QoQ earnings growth of -4.9%, that scenario requires a fundamental reversal. In this report: P/E 295x is the primary source of valuation sensitivity — at any signal that earnings growth will not materialize, the market can rapidly "de-rate" the multiple.
PEG Ratio (Price/Earnings-to-Growth)
What it is: P/E divided by the expected annual EPS growth rate in percent. PEG = 1.0 means "fair valuation" at the given growth rate. PEG < 1 = undervalued, PEG > 1 = overvalued relative to growth.
How it works: PEG eliminates the flaw in P/E analysis that fast-growing companies "deserve" a high P/E. If a company grows at 100% annually, a P/E of 100x gives a PEG of 1.0 — fair. For TSLA: PEG 4.01 at forward P/E 139x and EPS growth of ~35% means the stock is 4x overvalued even accounting for growth. In this report: PEG 4.01 is the fundamental basis for the "narrative premium" thesis — the market is paying for the story, not the earnings.
Disclaimer: This is not financial advice. This article represents personal analysis based on options flow data, market structure, and fundamental indicators. Every investment decision requires independent due diligence.