
What Is the VIX?
The VIX (CBOE Volatility Index) is a real-time index that measures the market’s expectation of 30-day forward-looking volatility of the S&P 500 index. It is calculated and published continuously by the Chicago Board Options Exchange (Cboe) during market hours and is derived directly from the prices of SPX options contracts.
The VIX was created in 1993 based on the financial economics research of Menachem Brenner and Dan Galai, who proposed a “Sigma Index” as early as 1989. The current methodology, adopted in 2003, uses a model-free approach that extracts implied variance from a wide strip of out-of-the-money SPX options across two expirations, then interpolates to produce a constant 30-day maturity estimate.
What the VIX is: a mathematically precise measure of what SPX options traders are collectively willing to pay for volatility over the next month. What the VIX is not: a prediction of market direction, a measure of historical (realized) volatility, or a simple fear gauge. While it tends to rise during market stress and fall during calm periods, its primary function is as a pricing benchmark for the options market.
A VIX value of 20 means the market expects the S&P 500 to move approximately ±20% on an annualized basis. To convert to a daily expected move: VIX ÷ √252 ≈ VIX ÷ 15.87. So VIX 20 ≈ ±1.26% daily expected move in the S&P 500 — the same √T scaling that underpins the Expected Move formula for any underlying.
How the VIX Is Calculated
The VIX calculation uses a model-free implied variance approach that does not depend on the Black-Scholes model or any specific option pricing formula. Instead, it aggregates the prices of a wide strip of OTM SPX options to compute the market’s expected variance directly.
The Model-Free Variance Approach
The calculation process, in simplified terms:
- Select two SPX option expirations that bracket the 30-day target: one with more than 23 days remaining and one with less than 37 days. The inclusion of SPX Weeklys (since 2014) ensures these two expirations always tightly bracket the 30-day window.
- For each expiration, select all OTM options (calls above the forward price, puts below) that have a non-zero bid price. Exclude any option where two consecutive strikes have zero bids — the cutoff rule that prevents illiquid far-OTM options from distorting the calculation.
- Calculate the variance contribution of each option using its price, strike spacing, and time to expiration. Each option’s contribution is weighted by 1/K² (inverse of strike price squared), which gives more weight to lower strikes — reflecting the put skew.
- Sum all contributions for each expiration to produce two variance estimates (σ²₁ and σ²₂).
- Interpolate between the two variances to produce a constant 30-day variance estimate.
- Take the square root to convert variance to standard deviation (volatility), and multiply by 100. The result is the VIX index value.
Why VIX Captures the Entire Volatility Surface
Because the VIX aggregates prices from dozens — sometimes hundreds — of individual SPX options across a wide range of strikes, it captures the entire implied volatility surface rather than just ATM implied volatility. This means the VIX encodes three distinct dimensions simultaneously: the level (how expensive options are overall), the term structure slope (whether near-term or far-term risk is more elevated), and the skew / kurtosis (how asymmetric the put vs. call pricing is). These are the same three principal components that Cont and da Fonseca (2002) identified as accounting for over 95% of day-to-day S&P 500 surface movement. For a full breakdown of how these three dimensions interact and how to trade each independently, see IV Surface: The Three-Factor Framework.
This surface-aggregation property is both the VIX’s strength and its main limitation. Because it compresses three surface dimensions into one number, the VIX cannot tell you which dimension is driving a change. A VIX spike from 18 to 28 could be caused by term structure inversion (near-term fear), by steep put skew expansion (downside-specific hedging), or by broad ATM IV expansion (general uncertainty). Each of these has different strategy implications — which is why the VIX must always be decomposed into its components for individual trade decisions.
VIX Levels: What They Mean
While the VIX is a continuous variable, certain ranges have historically corresponded to distinct market regimes. Understanding these ranges provides immediate context for the current volatility environment:
| VIX Range | Market Regime | Daily Expected Move (SPX) | Historical Context |
|---|---|---|---|
| 10–15 | Low volatility / Complacency | ±0.6–0.9% | Extended bull market periods; 2017 average ~11. Can precede volatility spikes (complacency trap). |
| 15–20 | Normal / Moderate | ±0.9–1.3% | Long-term average is approximately 19.5. Healthy, two-way market with normal risk pricing. |
| 20–25 | Elevated / Cautious | ±1.3–1.6% | Heightened uncertainty; pre-event positioning (elections, FOMC). Options premiums are rich. |
| 25–35 | High / Fear | ±1.6–2.2% | Active market stress; corrections; geopolitical events. Premium selling becomes profitable. |
| 35–50 | Extreme / Crisis | ±2.2–3.2% | Rare events: COVID crash (March 2020, VIX peaked at 82), 2008 financial crisis. |
| 50+ | Panic | ±3.2%+ | Historically occurs only during systemic crises. Market function may be impaired. |
The VIX’s long-term average is approximately 19.5. This means a VIX reading of 20 is “normal” — not high, not low. Many retail traders perceive VIX 20 as elevated because extended low-volatility periods (2017, mid-2024) reset psychological baselines. Always compare the current VIX to its own historical range, not to your recent experience. The same principle applies at the single-stock level: the IV Rank and IV Percentile metrics provide this historical contextualization for any individual stock, independent of what the VIX is doing.
VIX and the S&P 500: The Asymmetric Relationship
The VIX has a well-documented inverse and asymmetric relationship with the S&P 500. This relationship is not mechanical (the VIX is not calculated from SPX price) but rather behavioral and structural:
- Inverse correlation: When the S&P 500 falls, the VIX typically rises — and vice versa. The correlation is approximately −0.75 to −0.85 on a daily basis, making it one of the strongest inverse relationships in financial markets.
- Asymmetric magnitude: The VIX rises more on down days than it falls on up days of the same magnitude. A −2% SPX day might produce a +15% VIX spike, while a +2% SPX day produces only a −8% VIX decline. This asymmetry directly reflects the structural put skew in SPX options: downside protection is always in higher structural demand than upside calls.
- Mean-reverting: Unlike stock prices, the VIX is strongly mean-reverting. Extreme VIX levels (both high and low) tend to revert toward the long-term average. VIX cannot sustain 50+ because options premiums at that level are too expensive to maintain. Conversely, VIX cannot stay at 10 indefinitely because any market shock will spike it. This mean-reversion property is the structural foundation of systematic volatility-selling strategies.
The VIX measures expected volatility, not directional expectation. A VIX of 30 means the market expects large moves — but says nothing about whether those moves will be up or down. The put skew embedded in SPX options gives the VIX a slight upward bias during fear events, but the index itself is direction-agnostic. Use VIX for regime assessment (how much movement?), not directional forecasting (which direction?). For the directional signal embedded in the skew, use the 25Δ Risk Reversal directly.
VIX Term Structure: Contango, Backwardation, and What They Signal
The VIX term structure is the curve plotting VIX futures prices across different expiration months. It reveals the market’s expectation of how volatility will evolve over time. This is distinct from the IV term structure of individual options (covered in the IV Surface framework), though they move together during macro stress events. The VIX term structure exists in one of two states:
Contango: The Normal State
In contango, longer-dated VIX futures trade at higher prices than shorter-dated ones (the curve slopes upward). This is the normal state approximately 80–85% of the time. Contango exists because there is more uncertainty over longer time horizons, and investors pay a premium for volatility protection that extends further into the future. In contango, the market is signaling: “Volatility is currently moderate, and we expect it to remain moderate or increase only gradually over time.”
For systematic options sellers, contango is favorable in two ways: it confirms that the volatility regime is stable (supporting premium-selling strategies), and it creates a structural roll yield for short-VIX-futures-based products like SVXY, which profit as near-term futures converge downward toward spot as they approach expiration.
Backwardation: The Stress State
In backwardation, near-term VIX futures trade at higher prices than longer-dated ones (the curve inverts). This occurs during acute market stress — when the current fear level is so elevated that the market expects volatility to decrease over time as the crisis resolves. The VIX term structure was in backwardation during the COVID crash (March 2020), the 2022 inflation scare, and various geopolitical shock events.
Backwardation is a powerful signal for two reasons:
- Crisis confirmation: When the term structure inverts, the market is not just pricing elevated volatility — it is pricing peak volatility, which implies the worst is already being priced in. This is the market’s collective statement that current conditions are the maximum of expected fear, not a waypoint to something worse.
- Mean-reversion setup: Because backwardation implies the market expects volatility to fall, and because the VIX is strongly mean-reverting, the transition from backwardation back to contango is historically one of the most reliable environments for both volatility sellers and equity buyers. The IV crush that follows peak VIX events is structurally identical to post-earnings IV crush described in the Expected Move guide — but at macro scale.
VIX vs. Realized Volatility: The Volatility Risk Premium
Historically, implied volatility (as measured by the VIX) overestimates subsequent realized volatility approximately 85–90% of the time. This persistent overpricing — the Volatility Risk Premium (VRP) — is the structural edge that options sellers systematically harvest at the index level.
For the full VRP treatment at the single-stock level — including IVR/IVP methodology, the IV–HV spread table, and the five-scenario strategy selection framework — see the Implied vs. Historical Volatility guide. The VIX quantifies this premium for SPX specifically; StrikeWatch EA’s Summary Surface module applies the same framework to any individual stock, showing whether the current VRP is wide (favorable for selling) or narrow (thin edge).
Trading Products Based on the VIX
The VIX index itself cannot be bought or sold directly — it is a calculated index, not a tradeable asset. Several derivative products provide exposure to VIX movements, each with fundamentally different risk profiles:
| Product | What It Tracks | Key Characteristic | Best For |
|---|---|---|---|
| VIX Futures | Expected VIX at future settlement date | Subject to roll cost (contango decay); converge to VIX spot at expiration | Professional volatility traders; tactical hedging |
| VIX Options | Options on VIX futures (not VIX spot) | European-style; settlement based on VIX Special Opening Quotation (SOQ) | Defined-risk volatility bets; event hedging |
| VXX / UVXY (ETNs/ETFs) | Short-term VIX futures (1–2 month constant maturity) | Severe contango decay — lose ~50–70% annually in normal markets | Short-term tactical use ONLY; never buy-and-hold long |
| SVXY (Short Volatility ETF) | Inverse of short-term VIX futures | Profits from contango roll yield; extreme tail risk during VIX spikes | Systematic volatility-selling exposure with defined tail risk |
| SPX Options (directly) | SPX implied volatility = the VIX input | Most direct exposure; full Greek control; liquid and capital-efficient | The professional approach to trading index volatility |
VIX ETNs (VXX, UVXY) are designed to lose value over time. Due to contango in VIX futures, these products lose approximately 50–70% of their value annually in normal markets. They are useful for short-term hedging (days, not weeks) but are guaranteed to erode capital if held as long-term positions. UVXY, a 1.5x leveraged product, amplifies both gains during VIX spikes and the losses from contango decay. Never hold these products as a “portfolio hedge” unless you are actively managing the position daily.
Using VIX Data for Strategy Selection
The VIX level does not tell you what to trade, but it tells you how to trade. Different VIX regimes favor different options strategies based on the relationship between implied volatility, the VRP, and the risk of a regime change:
| VIX Regime | Favored Strategies | Avoid | Rationale |
|---|---|---|---|
| Low (<15) | Long options; debit spreads; straddles; calendar spreads | Selling premium (credit too thin) | Cheap options = high gamma per dollar. Premiums collected from selling are too small to justify the tail risk of a VIX spike from complacent levels. |
| Normal (15–20) | Full strategy menu; spreads in both directions | Naked short options | Balanced environment; moderate edge for both buyers and sellers. No structural vol signal in either direction. |
| Elevated (20–30) | Credit spreads; iron condors; put writing; selling strangles | Buying long-dated options (expensive vega) | Rich premiums = favorable for sellers. VRP is widest in this range, providing the strongest structural edge for income strategies. |
| High (30–50) | Selling premium (wide defined-risk spreads); cash-secured puts at target prices | Buying OTM options (overpaying for IV); naked short without defined risk | Extreme premiums but also extreme risk. The gap between expected and realized vol is widest, but tail events can be catastrophic. Defined risk only. |
| Extreme (>50) | Reducing position size; waiting for backwardation-to-contango transition | Any large-size position; holding over weekends | Crisis conditions. Capital preservation is the priority. The best entries come after VIX peaks and the term structure begins its transition back to contango. |
This VIX-based framework operates at the macro level and sets the overall volatility posture. For individual stock positions, refine it with IV Rank and IV Percentile at the stock level — a stock can have IVR of 85 while VIX is at 15, making it a premium-selling candidate even in a low-VIX environment. The VIX provides the regime context; IVR/IVP provides the individual opportunity.
Common VIX Misconceptions
The VIX is one of the most widely followed but least well-understood market indicators. These misconceptions are pervasive even among experienced traders:
- “A high VIX means the market will crash.” The VIX measures expected volatility, not direction. A VIX of 30 means the market expects large moves — up or down. Some of the strongest rally days in history occurred during elevated VIX periods: the 2020 recovery saw VIX remain above 25 while the S&P rallied 50%+ from the lows.
- “VIX 12 means the market is safe.” Low VIX reflects current complacency, not future safety. VIX near 10 in January 2018 was followed by the “Volmageddon” event where VIX spiked to 37 in a single day. Extremely low VIX often signals the beginning of the next volatility cycle, not its absence. The GEX regime below the Zero Gamma Level is an earlier structural warning of impending volatility than VIX alone.
- “You can buy the VIX.” The VIX is a calculated index. All VIX-related products (futures, ETNs, ETFs) track VIX futures, which have their own dynamics (contango, roll yield, term structure). VXX, UVXY, and SVXY have fundamentally different long-term return profiles than VIX spot — their returns are dominated by roll costs, not VIX direction.
- “VIX predicts the next 30 days.” The VIX prices 30-day expected volatility, but it is not a forecast with a confidence interval. It reflects the current consensus, which can change dramatically in hours. Think of VIX as today’s price for 30-day insurance, not as a prediction of what will happen.
- “IV Rank is the same as VIX.” IV Rank compares a specific stock’s current IV to its own 52-week range. The VIX measures SPX options only. A stock can have IVR of 90 while VIX is at 15 — or IVR of 20 while VIX is at 35. These are entirely independent measurements for different instruments and different purposes.
VIX Analytics Inside StrikeWatch EA
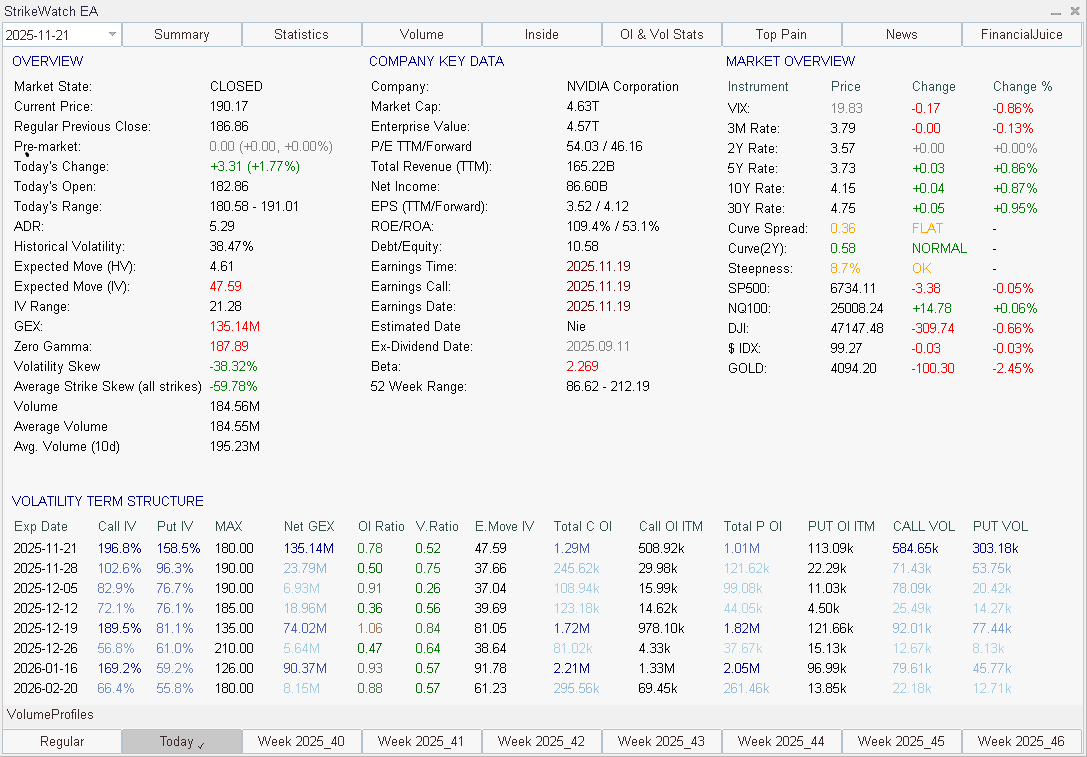
StrikeWatch EA does not display the VIX index directly (it is available on any data feed), but it provides the components that the VIX aggregates — decomposed at a per-stock, per-strike, per-expiration level that is far more actionable for individual trade decisions than the aggregate index:
- IV Rank & IV Percentile (Summary Surface): These contextual metrics tell you where current implied volatility stands relative to the past year for a specific stock. IVR above 50 = volatility is in the upper half of its range (favorable for sellers). IVR below 25 = volatility is historically cheap (favorable for buyers). This is the single-stock equivalent of the VIX regime table above — applied to your specific trade, not the S&P 500 index.
- IV vs. HV Spread: The Summary Surface shows the gap between current implied volatility and realized historical volatility — the VRP at the individual stock level. When IV significantly exceeds HV, the VRP is wide and premium selling has structural edge. When they converge, the edge is thin. For the complete methodology, see the IV vs. HV guide.
- Expected Move Module: The Expected Move bounds on your chart are derived from IV — the same variable the VIX aggregates. The 1-SD Expected Move is the VIX concept applied to a specific stock and expiration. For the formula, straddle shortcut, and GEX confluence mechanics, see the Expected Move guide.
- GEX Profile — Volatility Regime: Positive net GEX = volatility suppression (dealer hedging absorbs moves, VIX-like compression). Negative net GEX = volatility amplification (dealer hedging accelerates moves, VIX-spike characteristics). The GEX regime is the microstructural driver of the volatility that the VIX aggregates at index level. GEX gives you an earlier, more granular signal than the VIX can provide.
- 25Δ Risk Reversal and Butterfly (Summary Surface): The skew metrics that the VIX blends into a single number are displayed separately in StrikeWatch EA. The 25Δ RR shows the directional tilt (which tail is more expensive); the Butterfly shows kurtosis (how expensive both tails are). These give you the structural decomposition that the VIX aggregates and obscures.
Using VIX as a Vega Filter
The most practical translation of VIX into day-to-day trading is as a vega filter — a macro overlay that determines your net vega posture before you look at individual stock opportunities. Vega measures an option position’s sensitivity to changes in implied volatility. A positive net vega position profits when IV rises; a negative net vega position profits when IV falls. The VIX regime tells you which direction IV is more likely to move at the macro level, and therefore which vega direction to bias your portfolio toward:
| VIX Regime | Net Vega Bias | Preferred Structure | Rationale |
|---|---|---|---|
| VIX < 15 | Net long vega | Debit spreads; straddles; calendar spreads; long options | IV is historically cheap and more likely to expand than contract from complacent levels. Buying vega at historically low IV captures mean-reversion upside. |
| VIX 15–20 | Vega neutral | Defined-risk spreads in both directions; avoid large net-vega bets | IV is near its long-term average. No structural vega direction is favored at the macro level — let individual IVR/IVP drive strategy selection. |
| VIX 20–30 | Net short vega | Credit spreads; iron condors; cash-secured puts; strangles with wings | VRP is widest in this range. Selling vega at elevated levels harvests the structural premium overstatement. The edge is structural, not speculative. |
| VIX > 35 | Defined risk only | Wide credit spreads with purchased wings; no naked short vol | Premium is extremely rich but tail risk is real and immediate. Defined risk prevents catastrophic loss if VIX continues higher. Capital preservation overrides vega harvesting. |
Apply this vega filter at the portfolio level first, then use IVR and IVP at the individual stock level to identify the specific opportunities that align with the macro posture. A VIX of 25 (net short vega bias) combined with a stock at IVR 70 (individual premium-selling signal) is a high-conviction trade. The same VIX of 25 with a stock at IVR 15 (cheap individual IV) creates a conflict — the macro vega filter and the stock-level signal disagree, which is a signal to reduce size or wait for alignment. In StrikeWatch EA, the Summary Surface shows IVR and IVP for the loaded symbol, giving you the stock-level half of this two-level filter in real time.
The VIX is a pricing benchmark, not a fear gauge. It measures what SPX options
traders are collectively paying for 30-day volatility — a forward-looking consensus price, not
a prediction of direction or magnitude of any specific move.
VIX compresses three surface dimensions into one number. The same VIX level
can result from term structure inversion, steep put skew, or broad ATM IV expansion — each
with different strategy implications. Decompose VIX into its components (level, skew, term
structure) using the IV Surface
framework before acting.
The long-term VIX average is 19.5. VIX 20 is normal, not elevated. Always
compare VIX to its own history — not to whatever low-volatility period preceded it.
The same rule applies to individual stocks via IVR/IVP.
VIX term structure backwardation signals peak fear, not escalating fear.
When the curve inverts, the market is pricing the worst as now and expects
improvement. The backwardation-to-contango transition is historically one of the best
premium-selling entry points available.
Use VIX as a vega filter, not a trade signal. VIX < 15 → net long
vega. VIX 20–30 → net short vega. VIX > 35 → defined risk only. Apply this macro
overlay first, then refine at the stock level with IVR/IVP.
The VIX measures SPX only. Individual stocks require IVR and IVP for
contextualization. A stock at IVR 85 in a VIX 15 environment is a premium-selling opportunity
regardless of the macro regime. The two-level filter — VIX macro posture + IVR/IVP
individual signal — is the professional approach to volatility-based strategy selection.